Portly was hand-written by humans (me, specifically) with minimal AI input. For the moment, at least, I believe that nothing beats good old-fashioned human craftsmanship !

CGT reporting with Portly
Portly is able to apply HMRC's share-matching rules to your transaction history to work out your full CGT liability for the current and prior tax years. It understands things like notional dividends, stock-based dividends, crypto transfers and even 'equalisation' payments for certain funds.
You can find all the relevant information on the CGT tab. When you switch to the tab, the topmost 'banner' section will show your CGT liability for the current tax year (please note that this figure includes only investments held in taxable GIA accounts - if you don't hold GIA investments, it will be zero) :
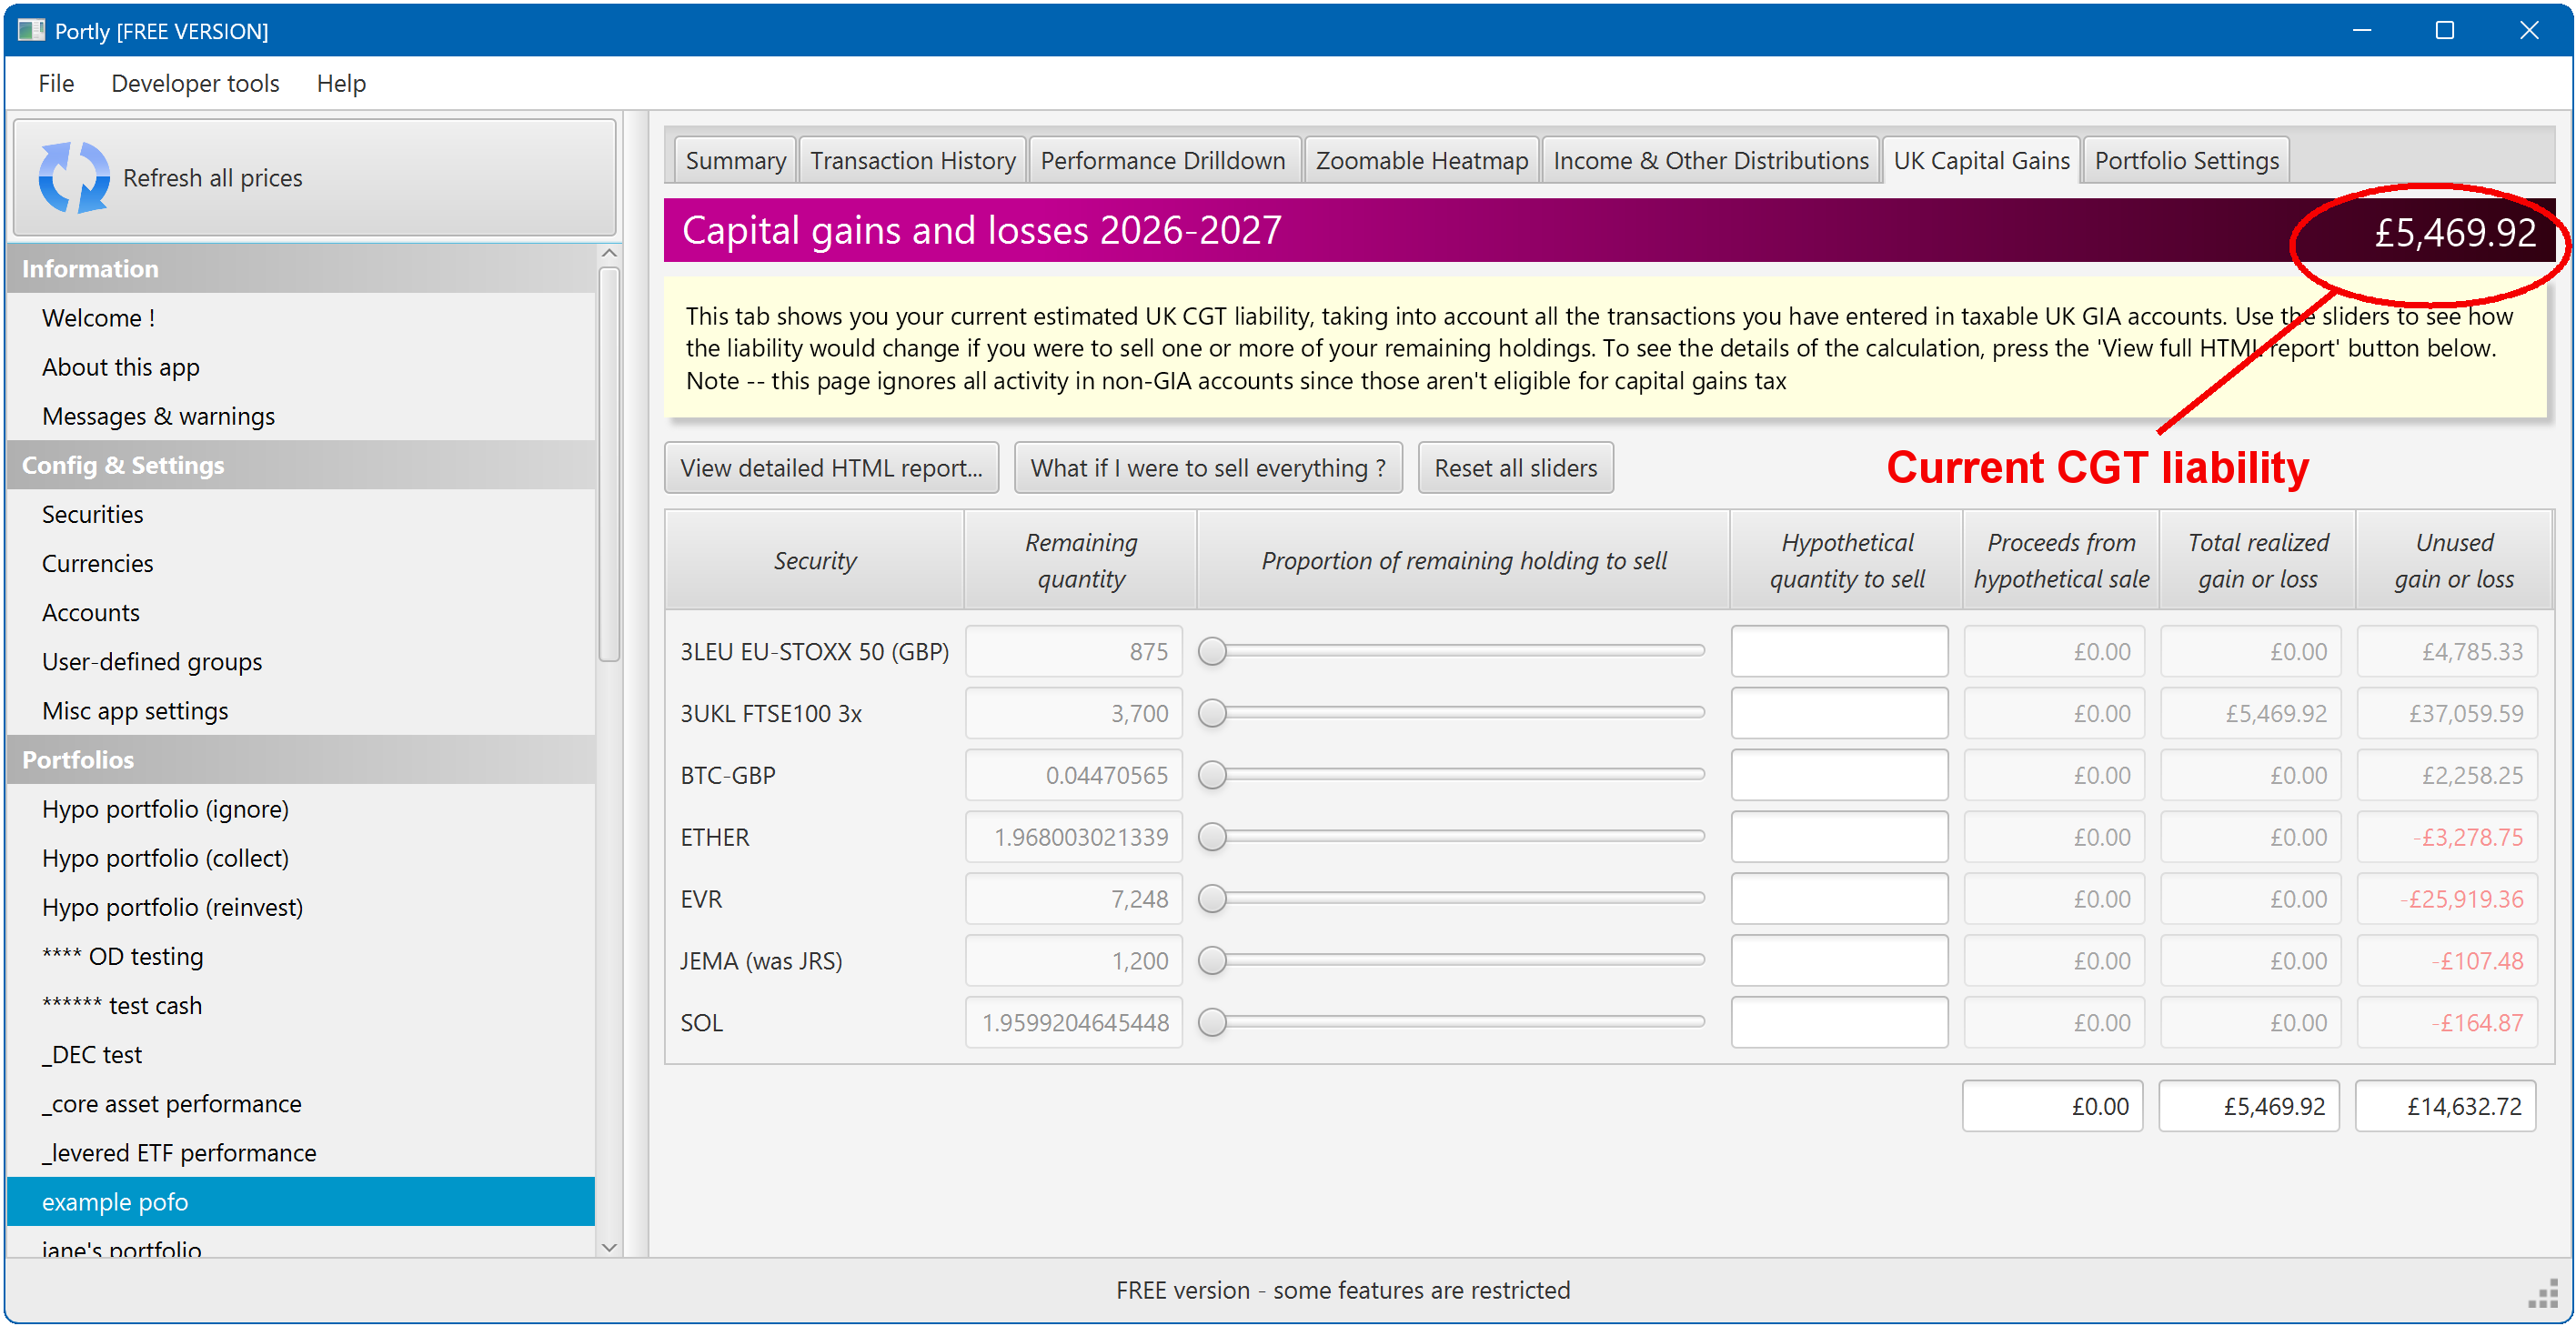
Below the banner, there's a button to generate a full HTML report so that you can inspect the calculation in detail. If necessary, you can attach this report to your annual Self Assessment return (I've been doing this for several years now - I use Microsoft's 'print to pdf' feature to convert the HTML to PDF).
Note that assets will be grouped inside the report according to the 'UK CGT type' that you specified when you first set up the security. Portly will then calculate a separate CGT liability for (eg) cryptoassets and listed shares, which is useful when you're filling out the Self Assessment pages (see the crypto page for more info).
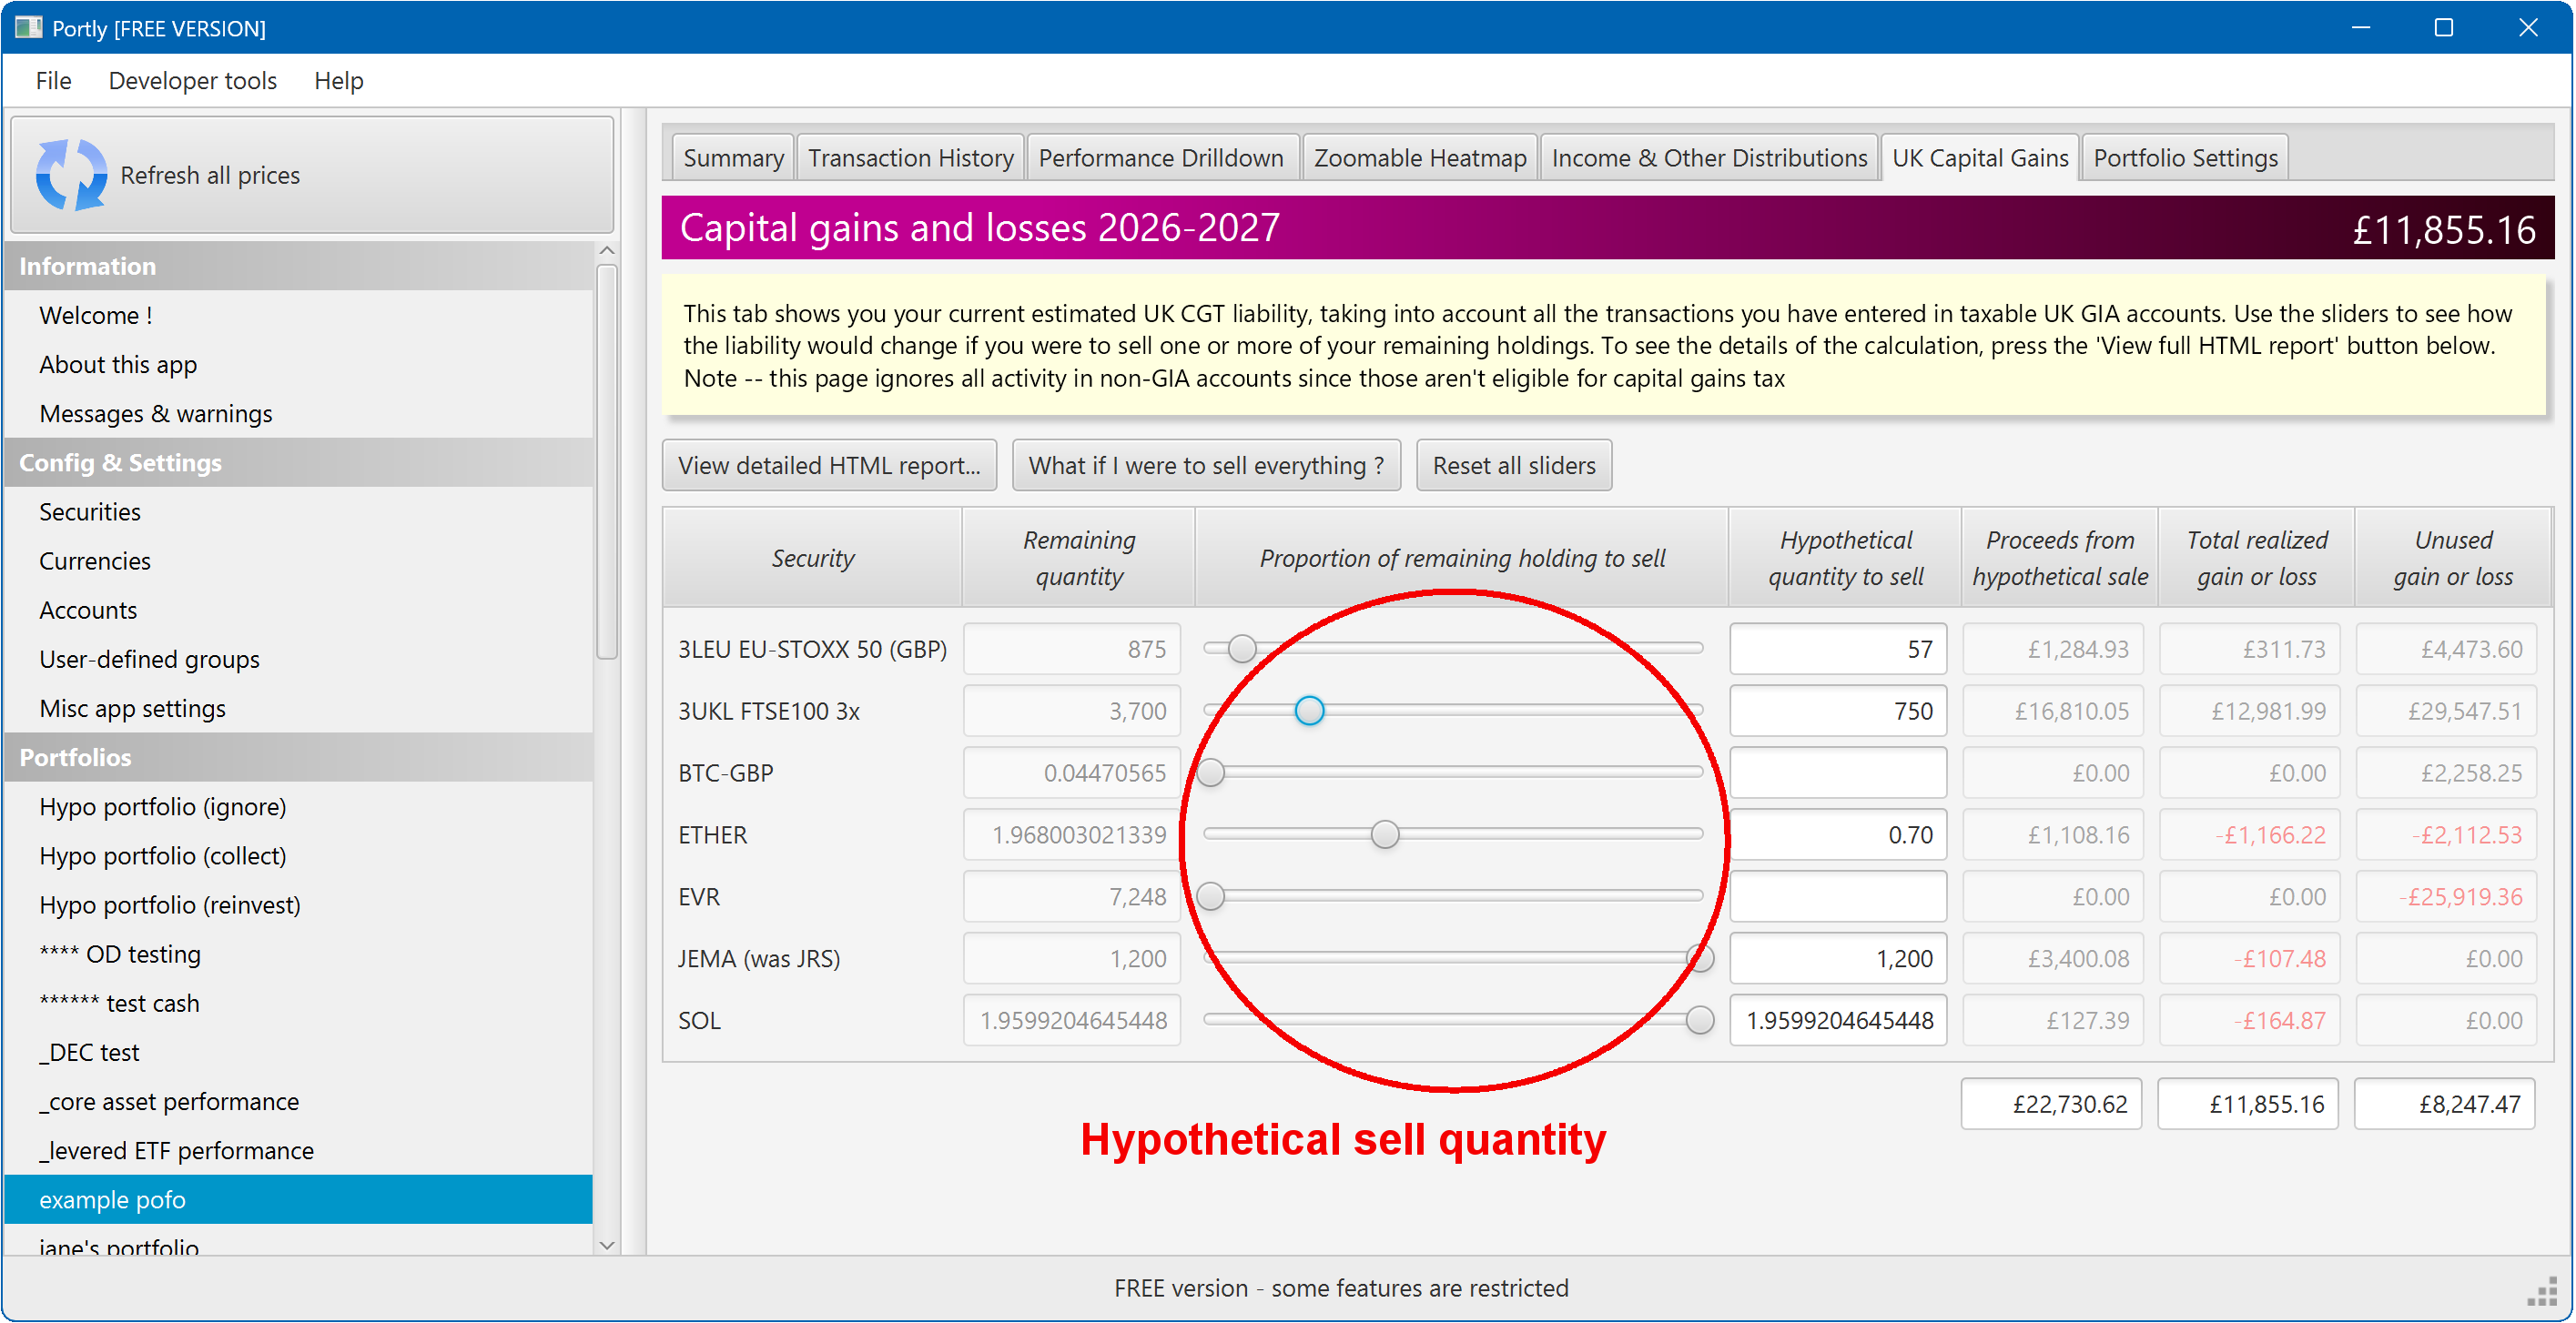
On the CGT screen, you can also view your hypothetical tax liability if you were to sell one or more of your holdings. You do this by simply moving one or more of the sliders to the desired quantity. You'll immediately see your updated CGT liability. Note that nothing you do on this screen will affect your actual portfolio permanently, it's just a way to do some quick 'what-if' analysis.
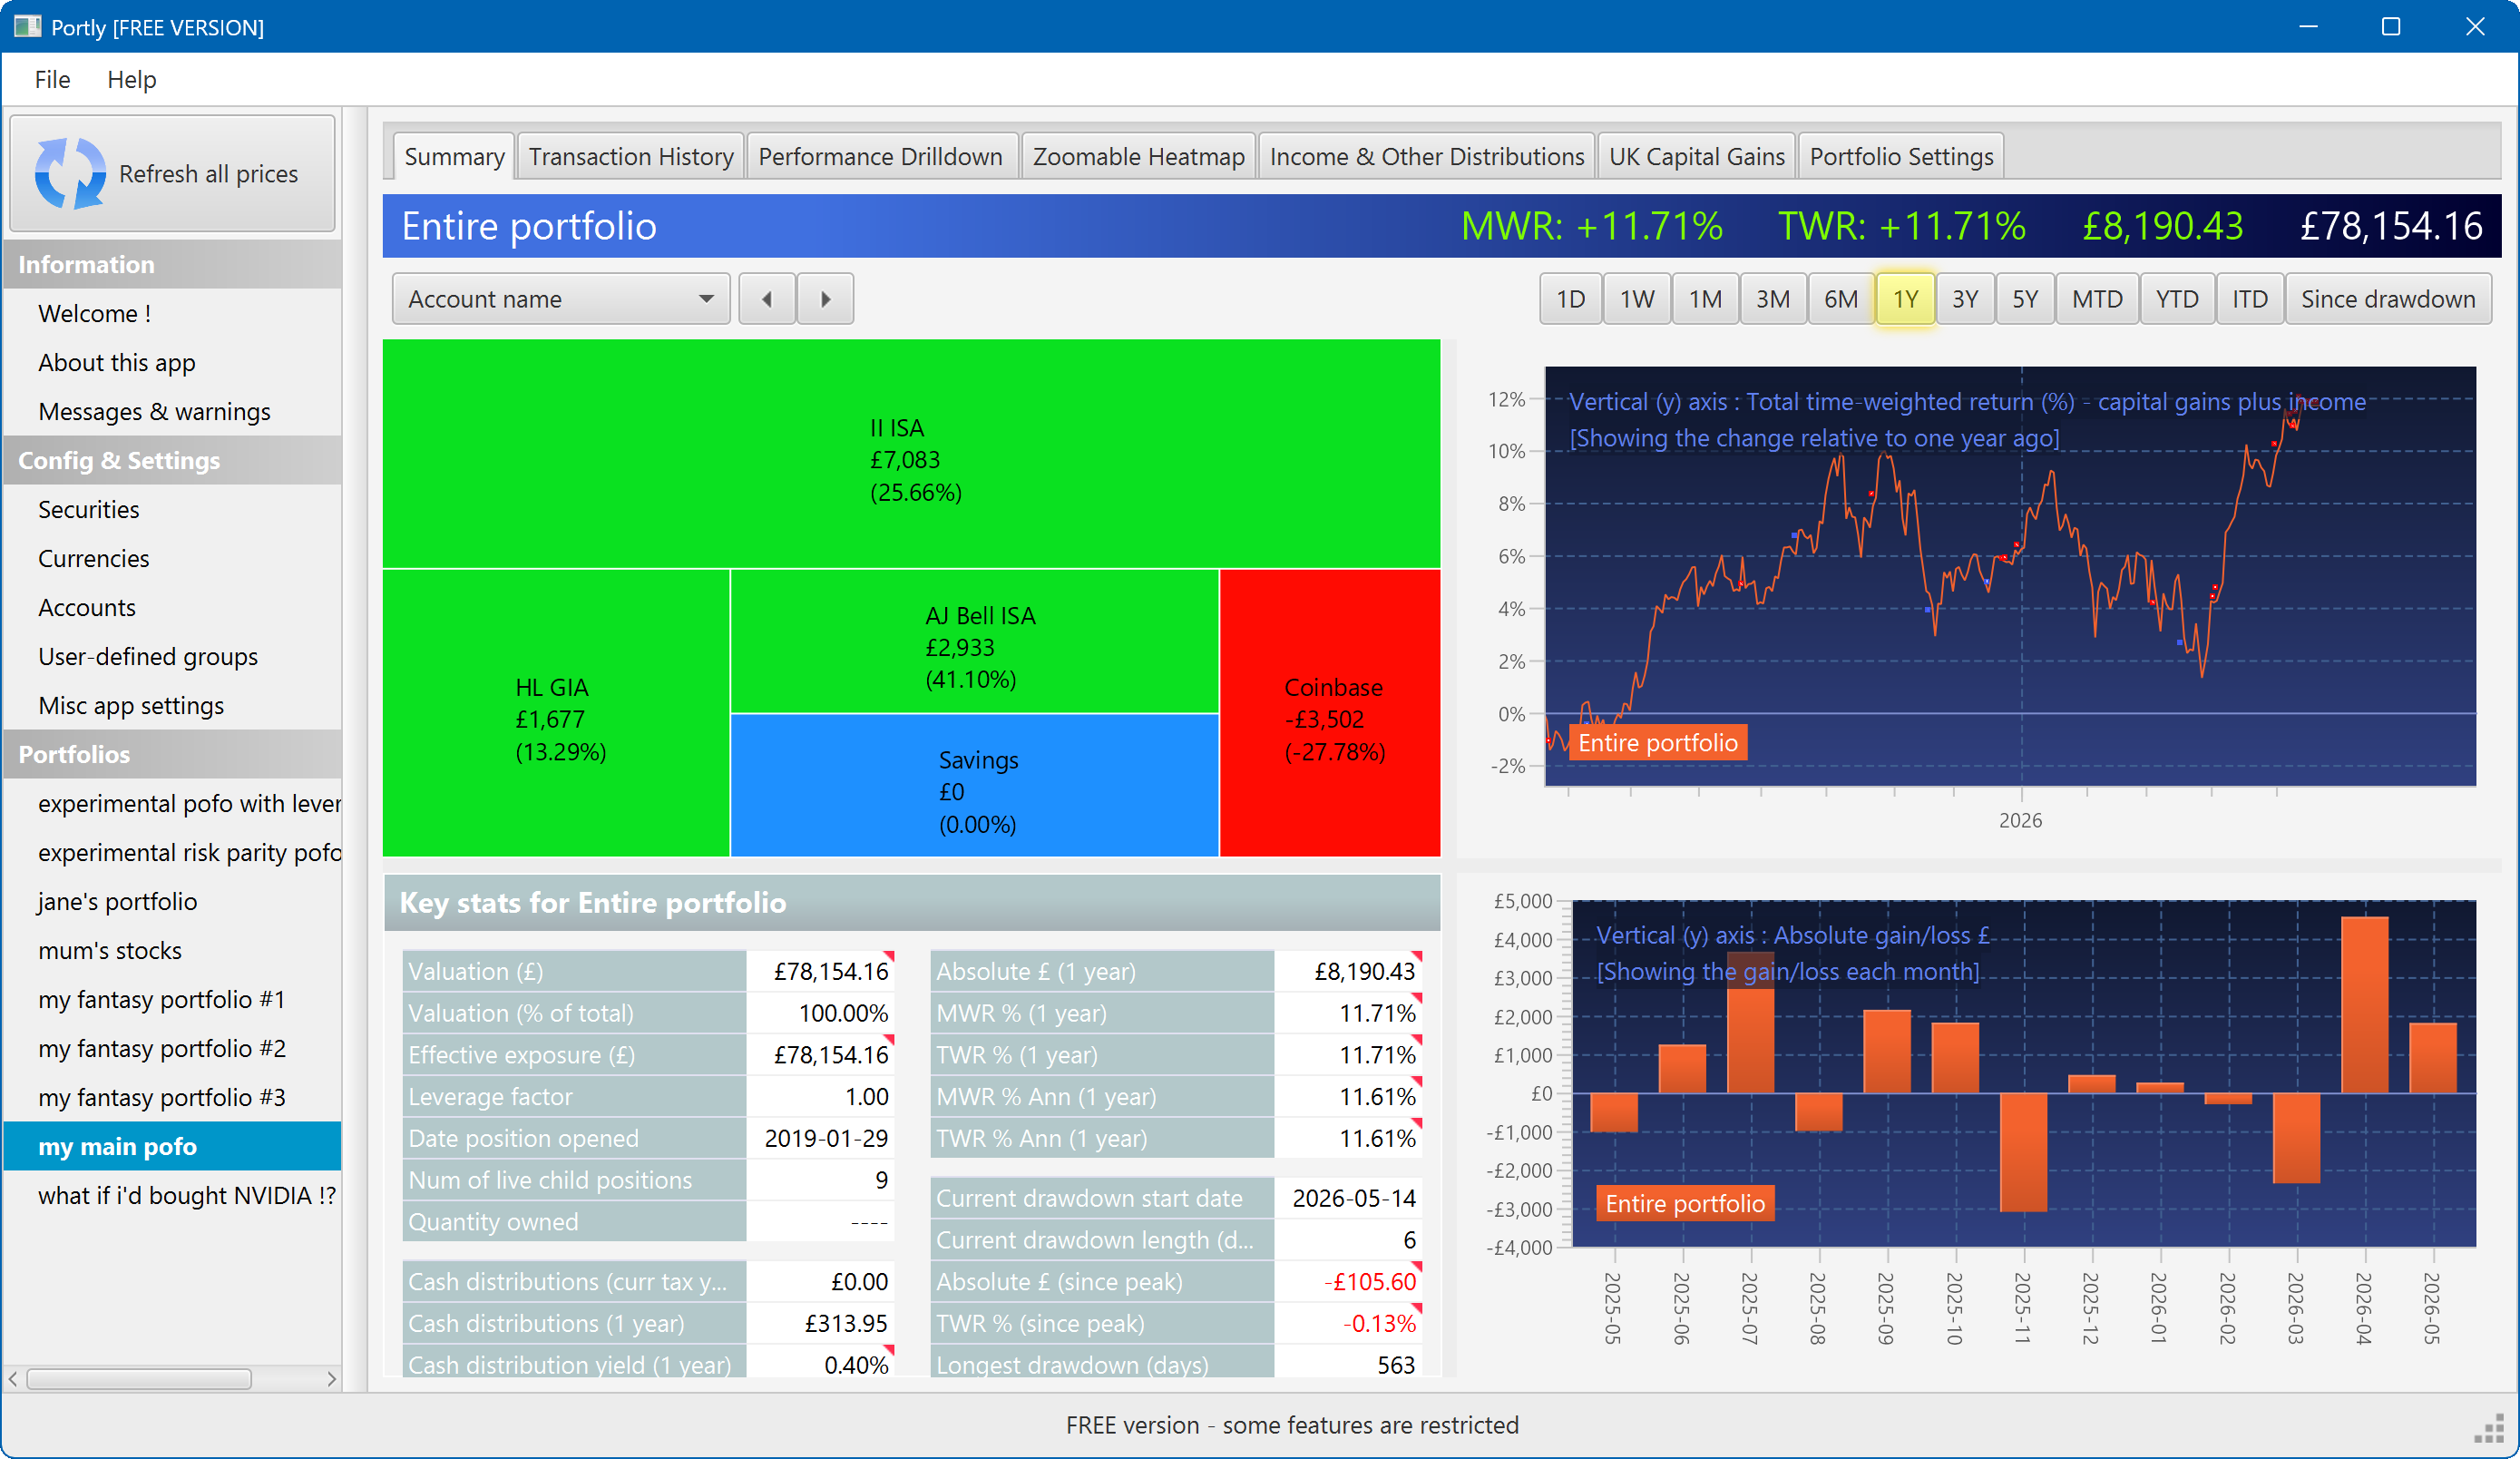
The summary screen gives an at-a-glance overview of your portfolio's performance. To read more about it, click here
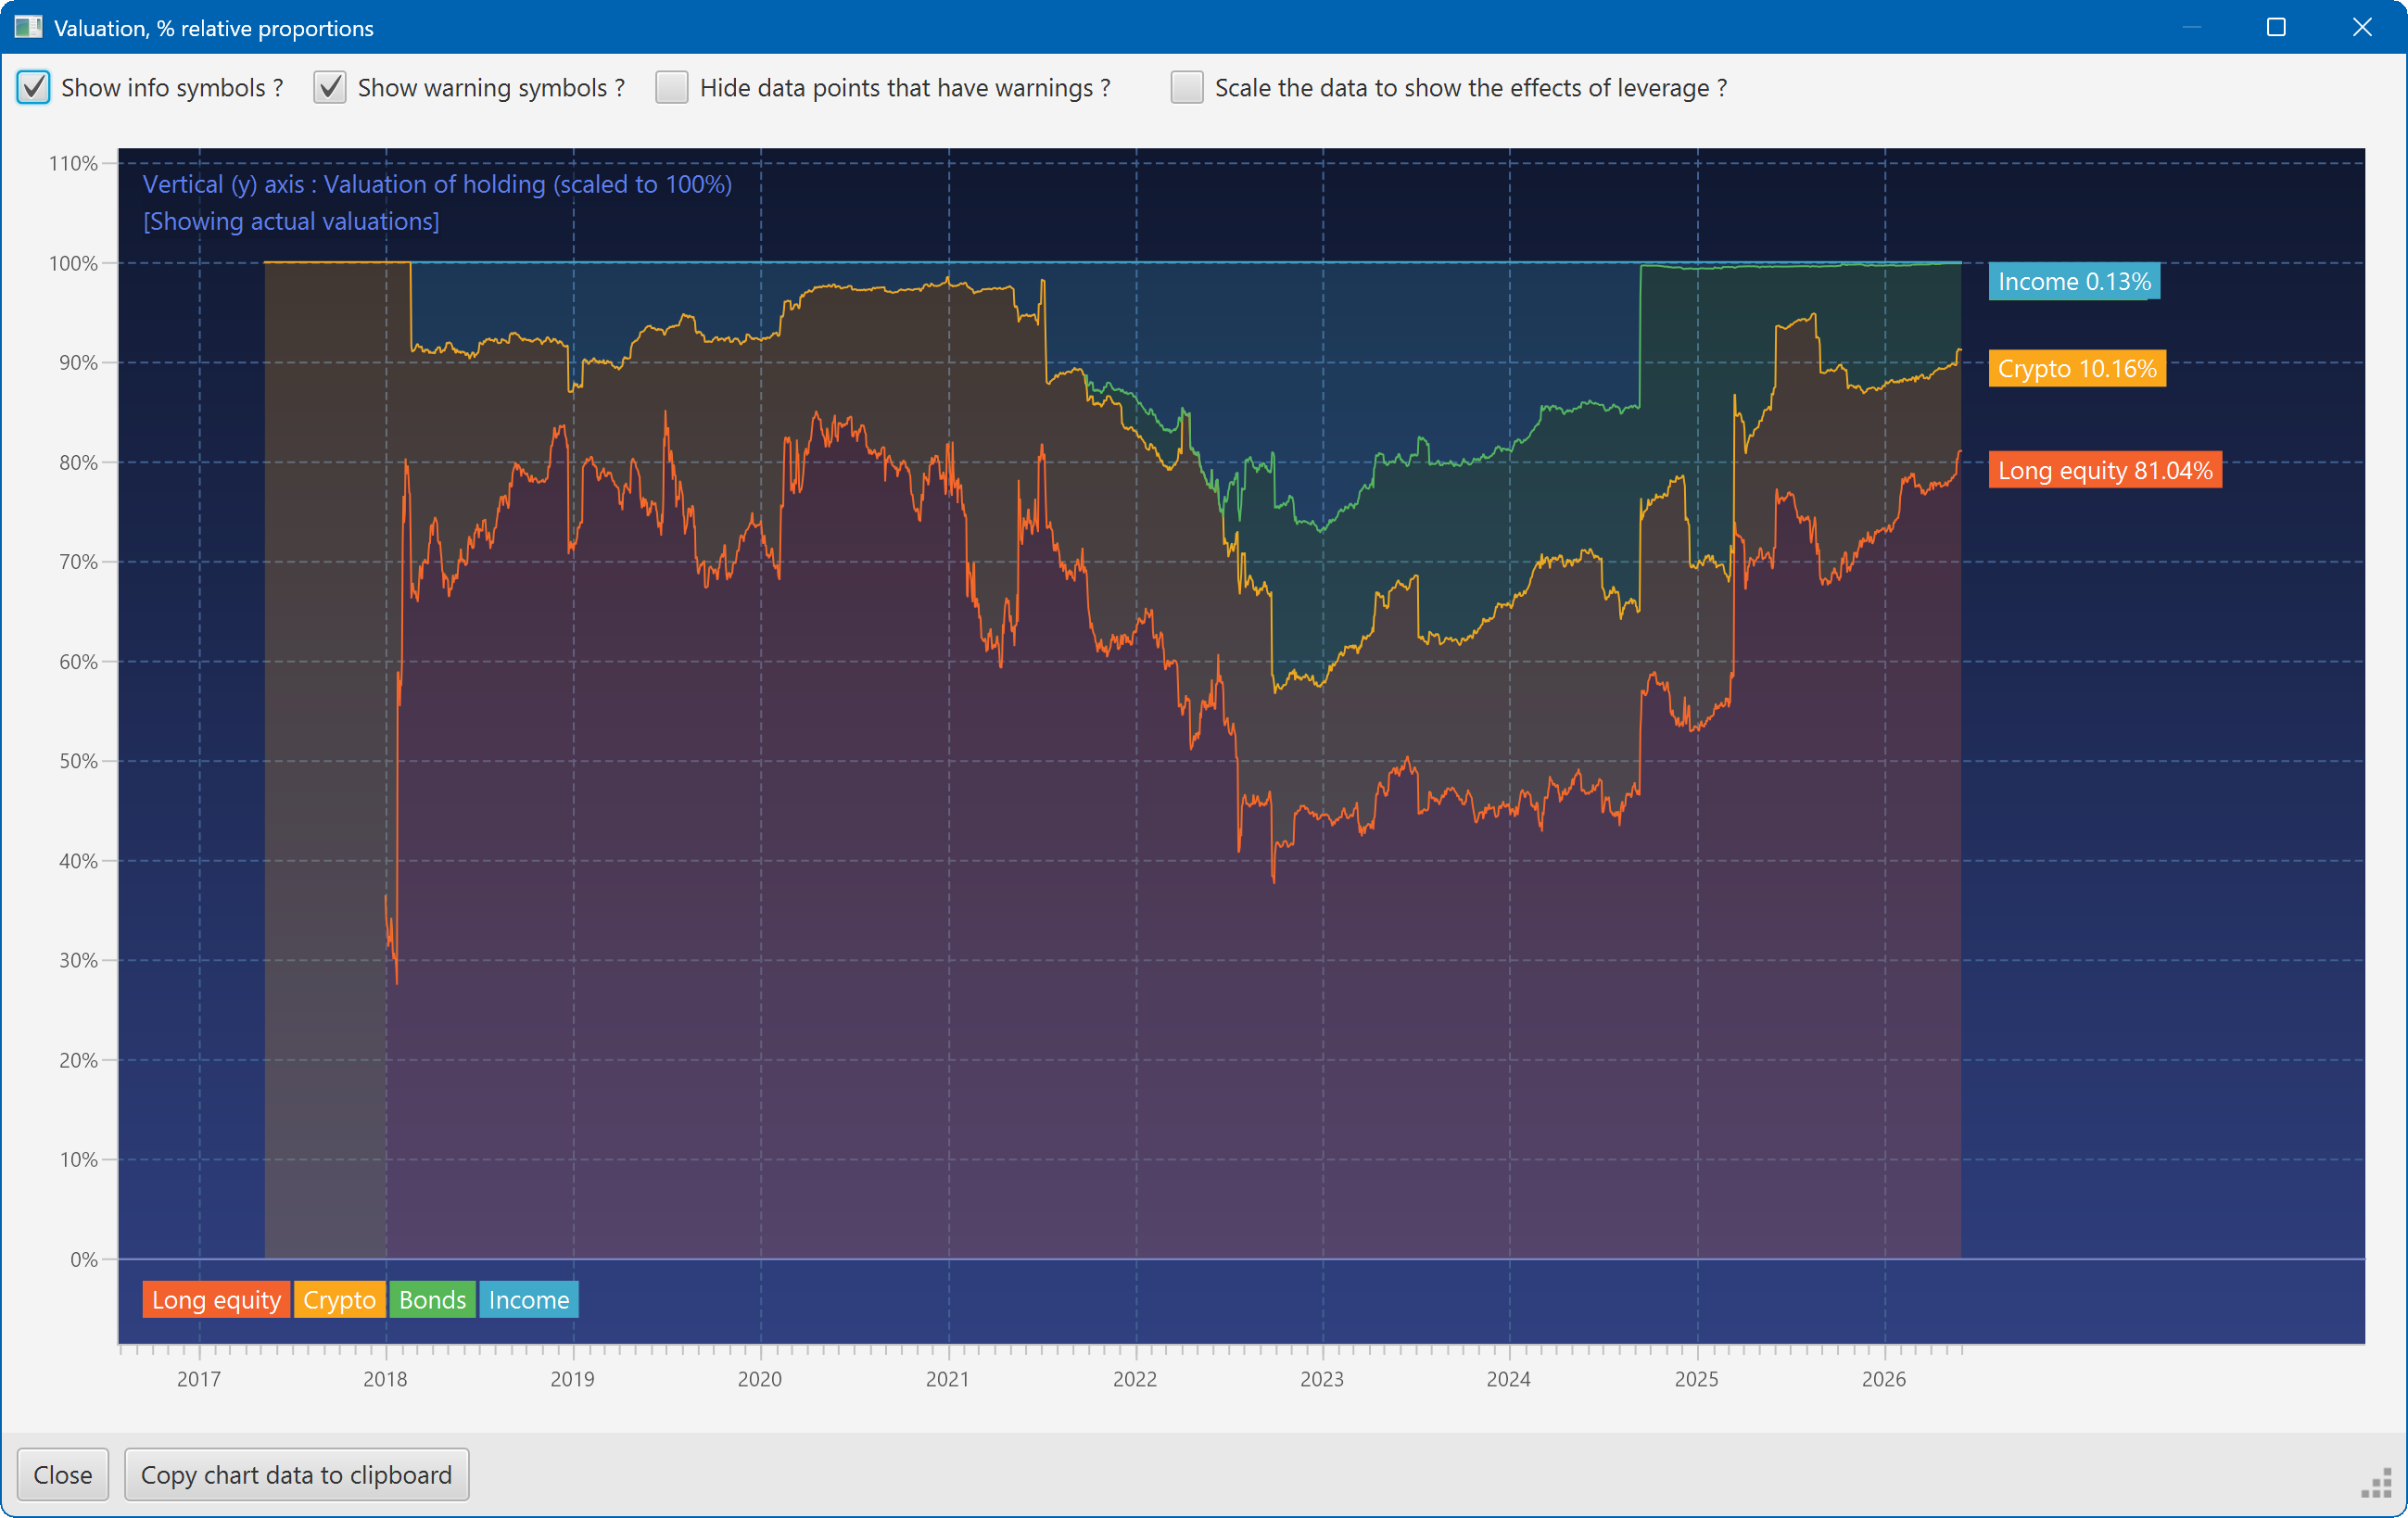
This plot shows the changing composition of a portfolio over time. It uses user-defined groups to organise the assets into different classes.
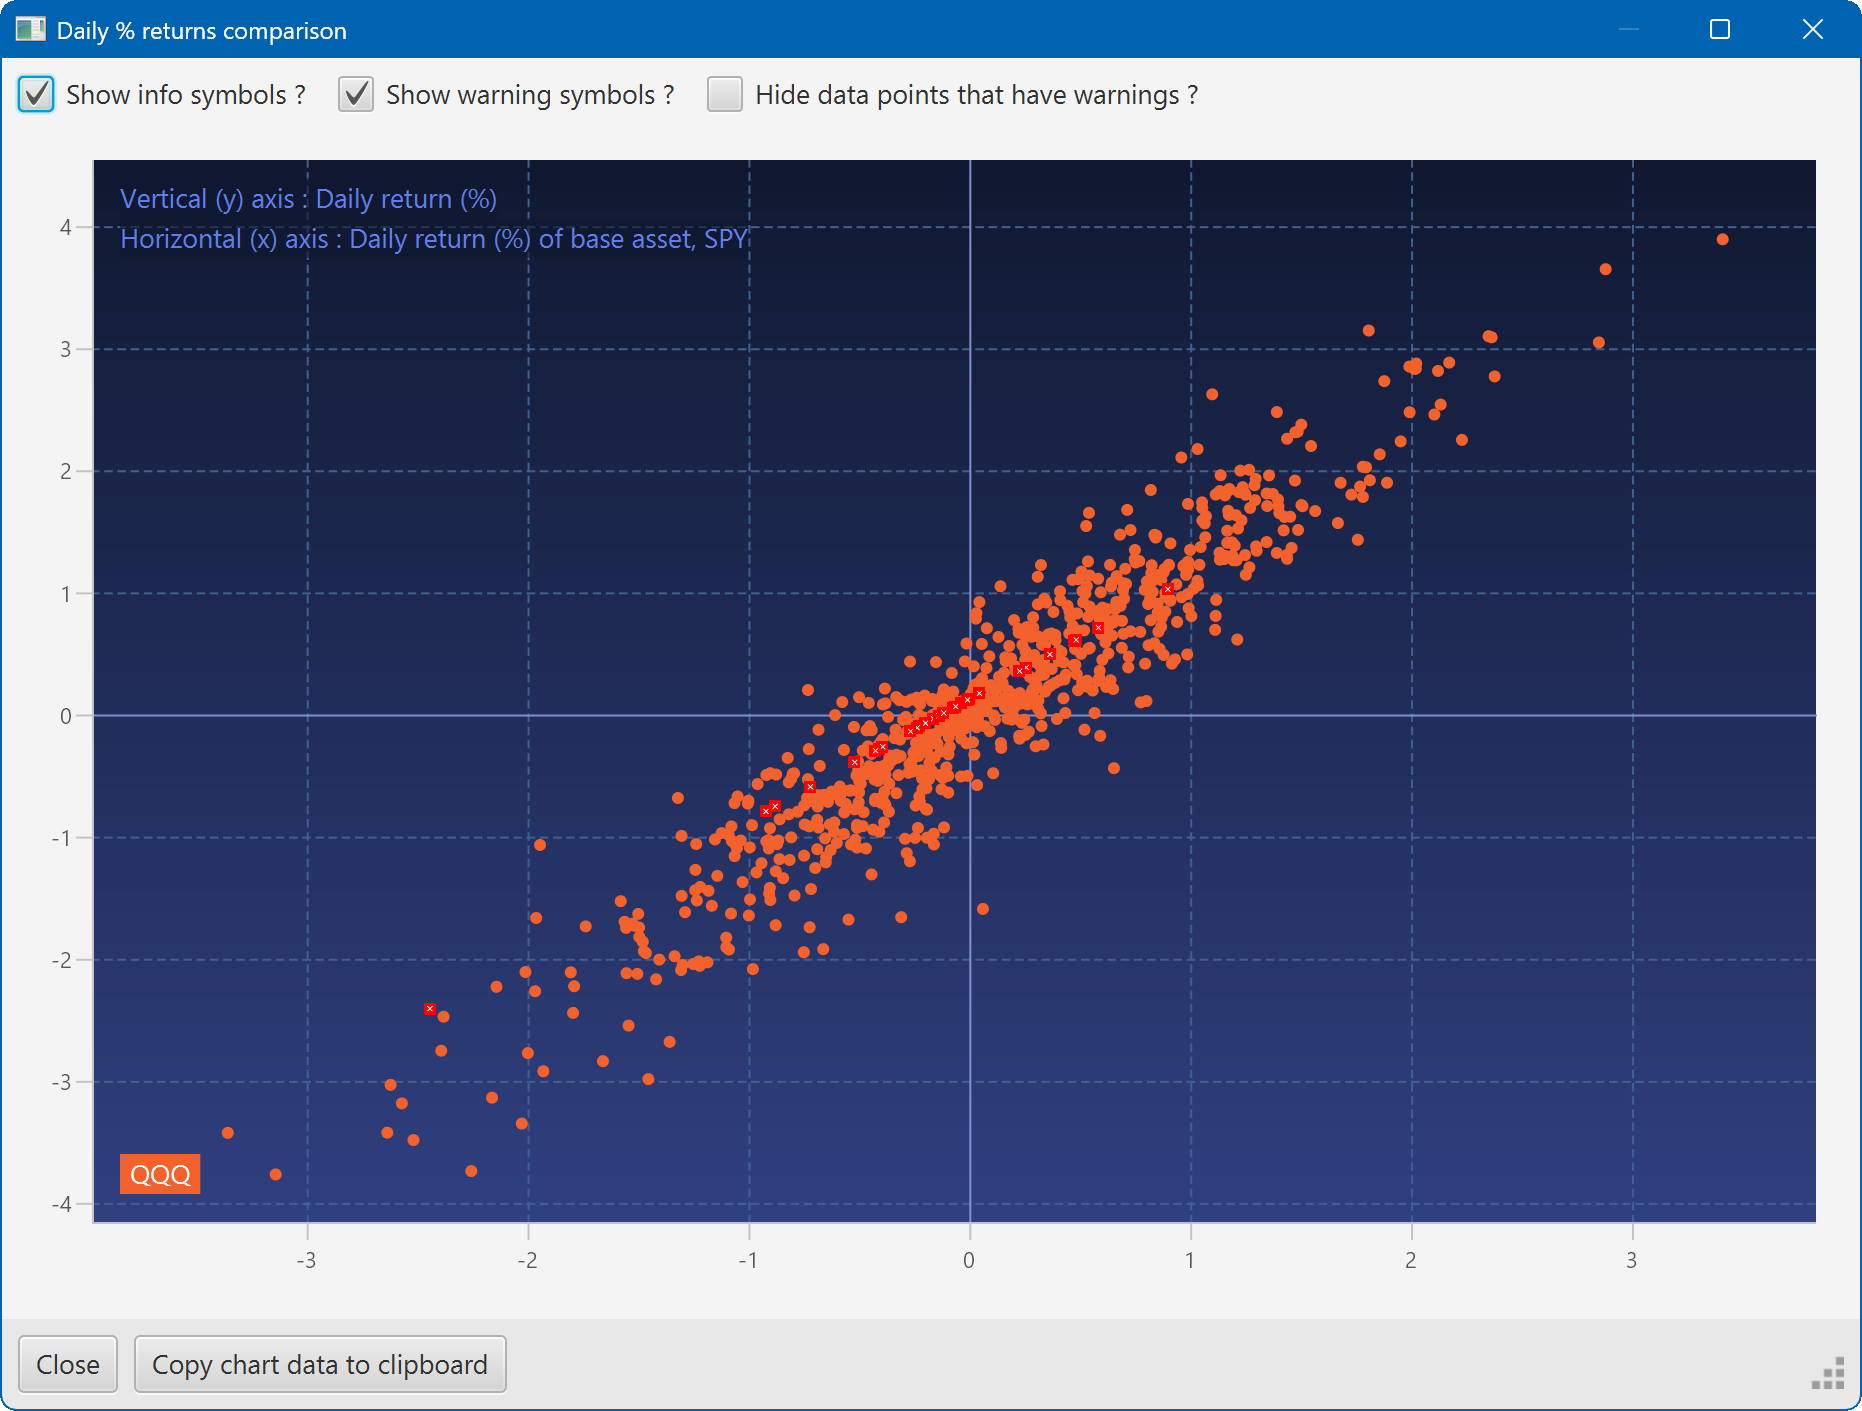
A scatter plot, showing how the daily moves of one security (QQQ) relate to the daily moves of another (SPY)
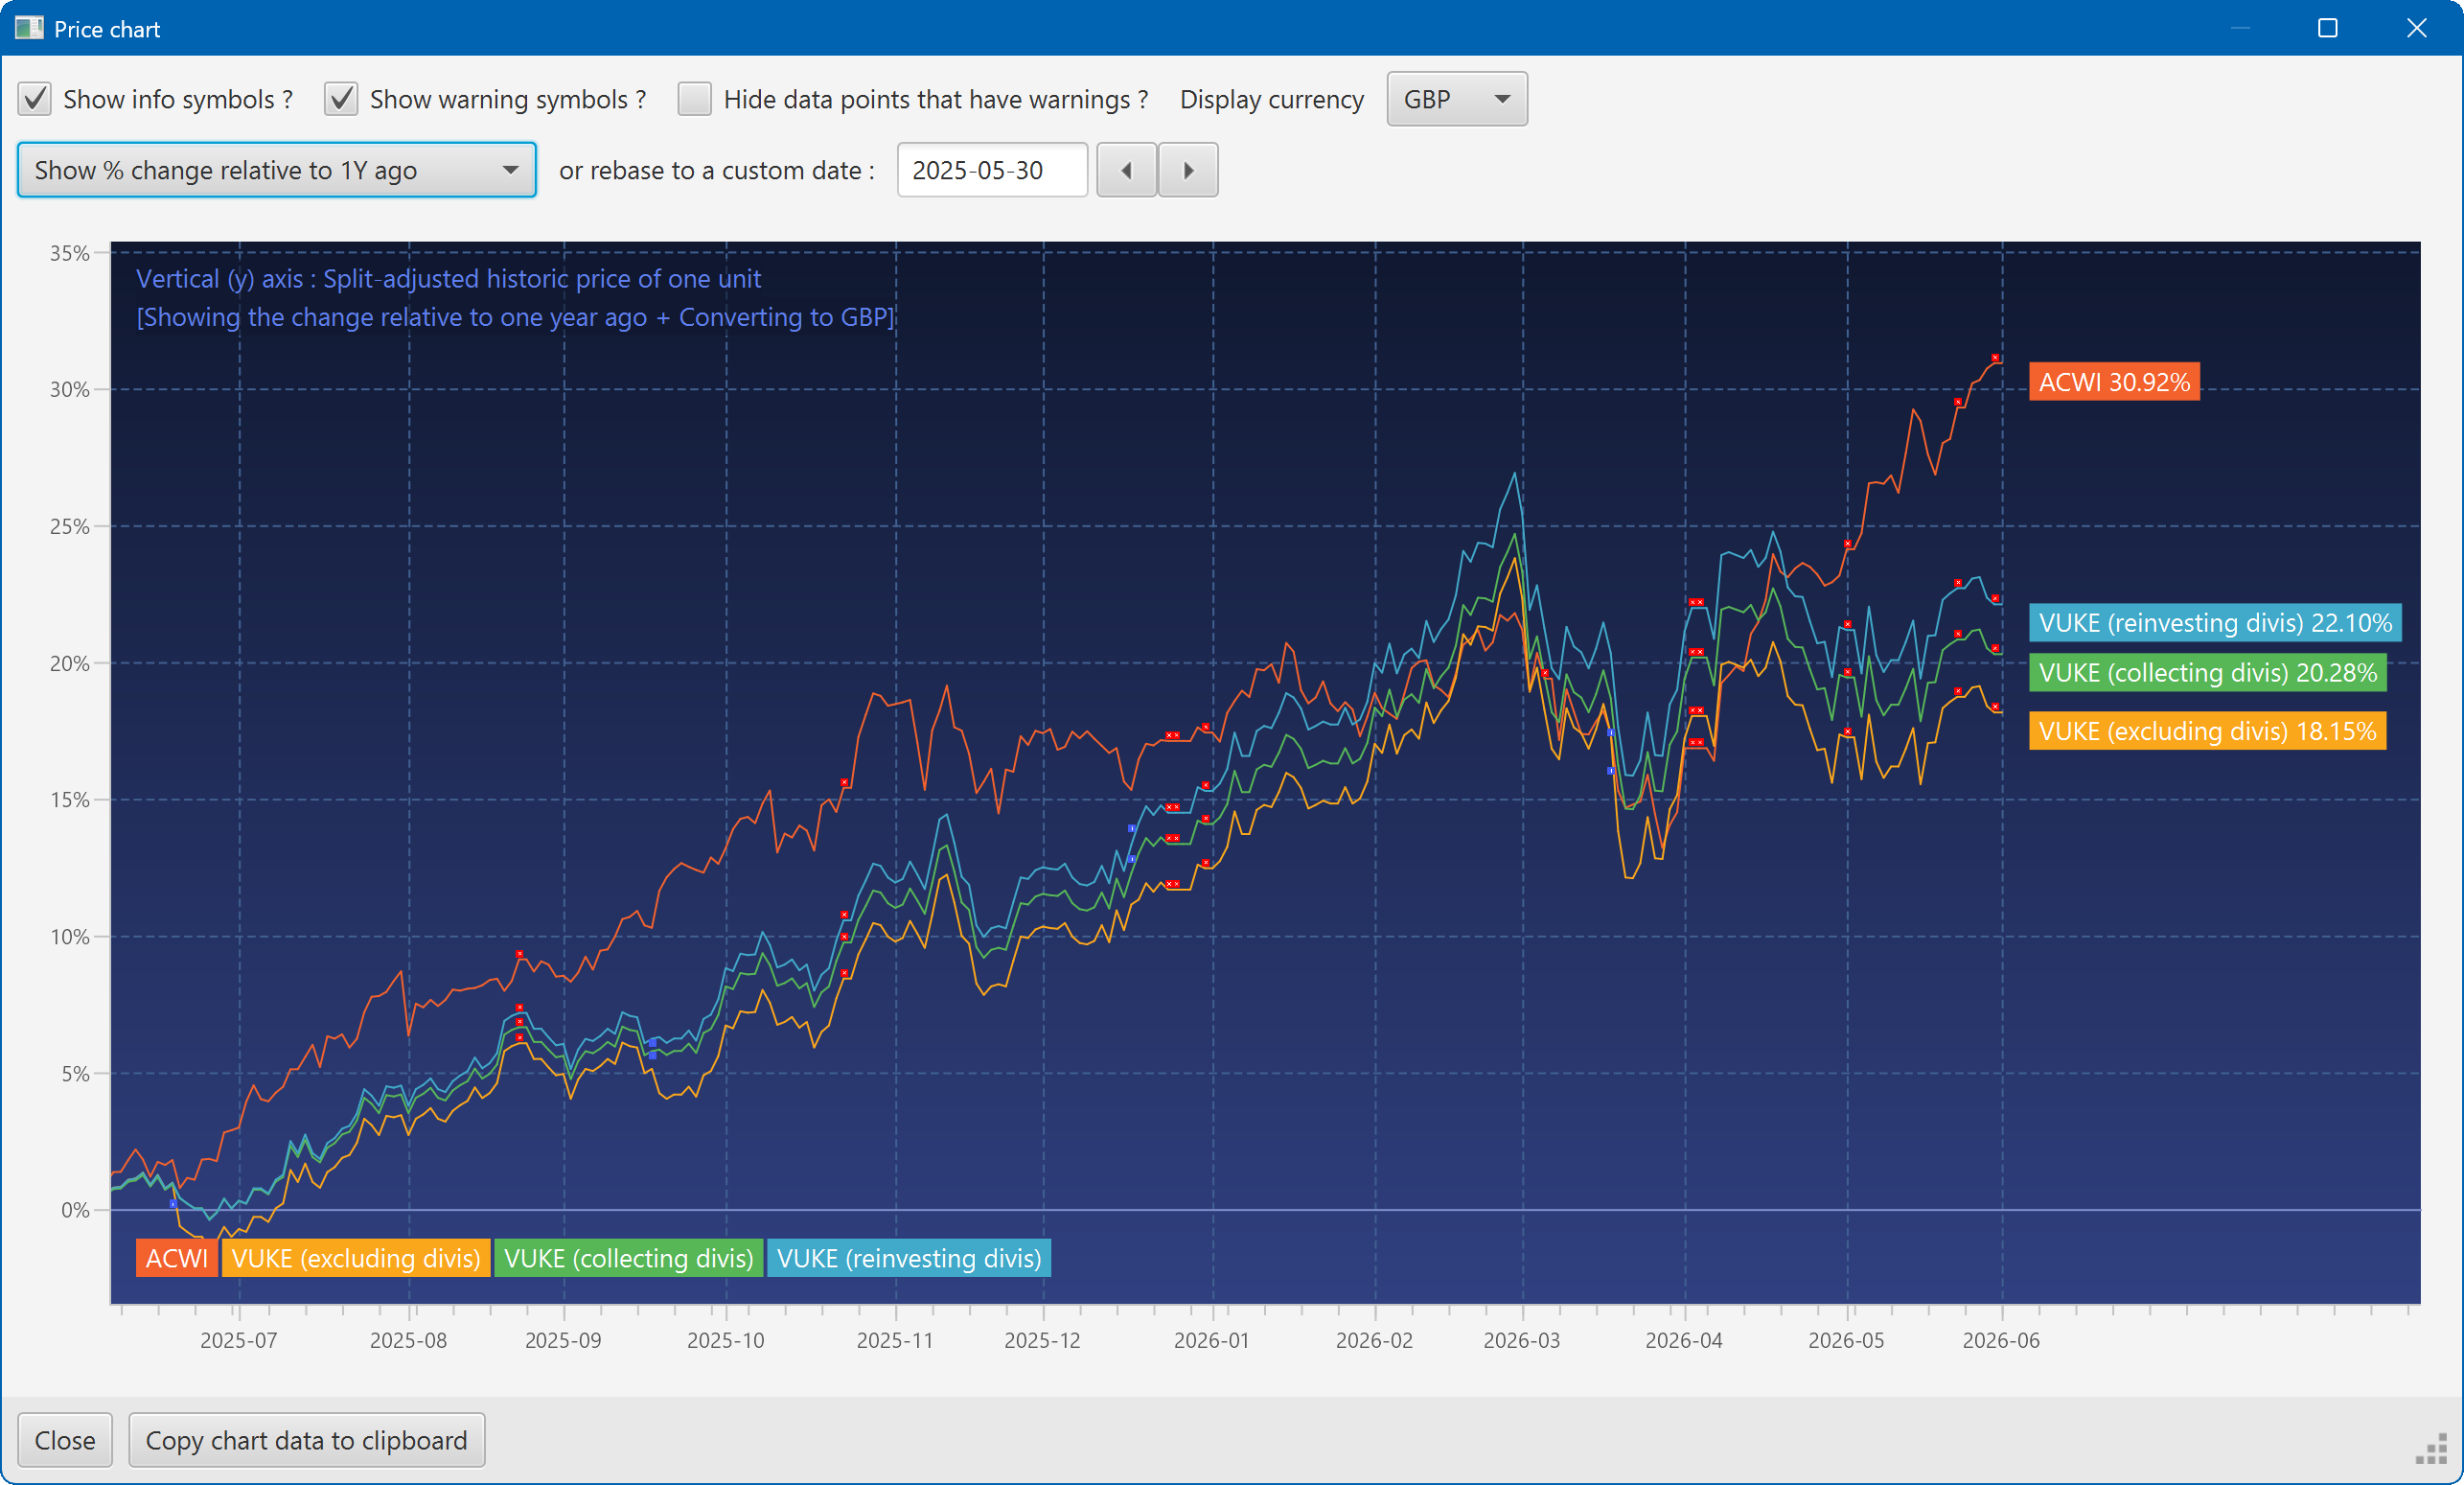
A chart showing the growth of two securities over the past year
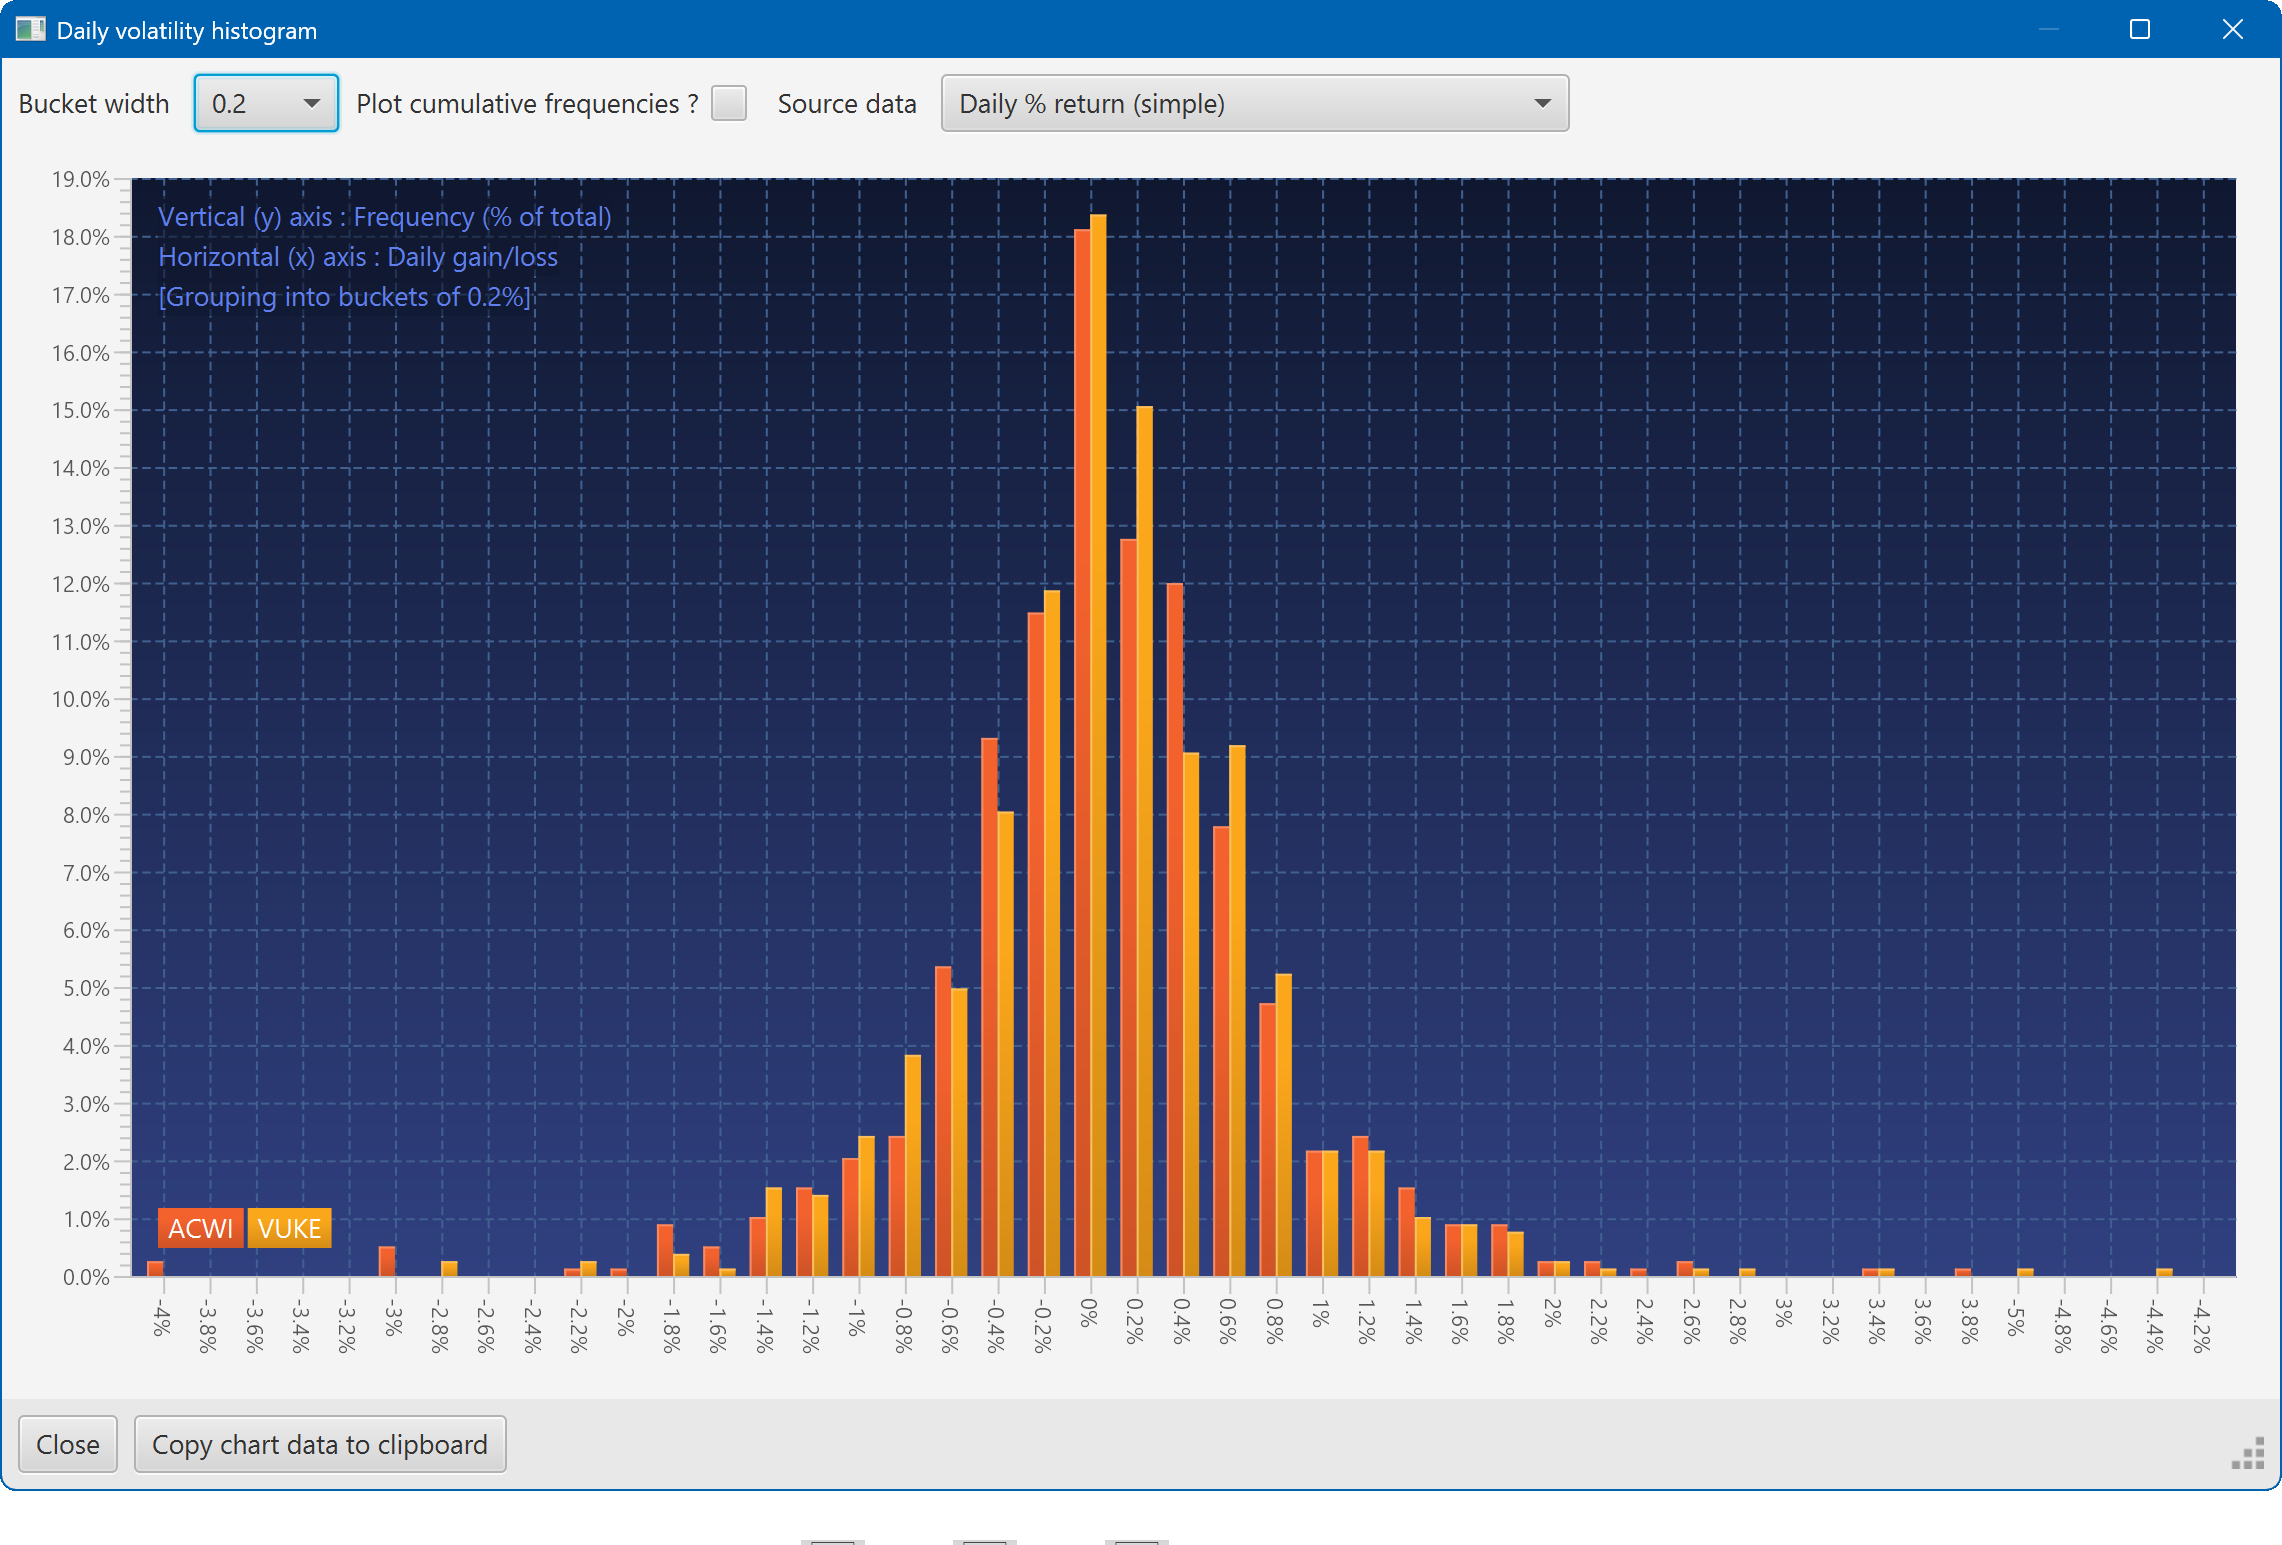
A histogram showing the daily returns of two securities, overlaid
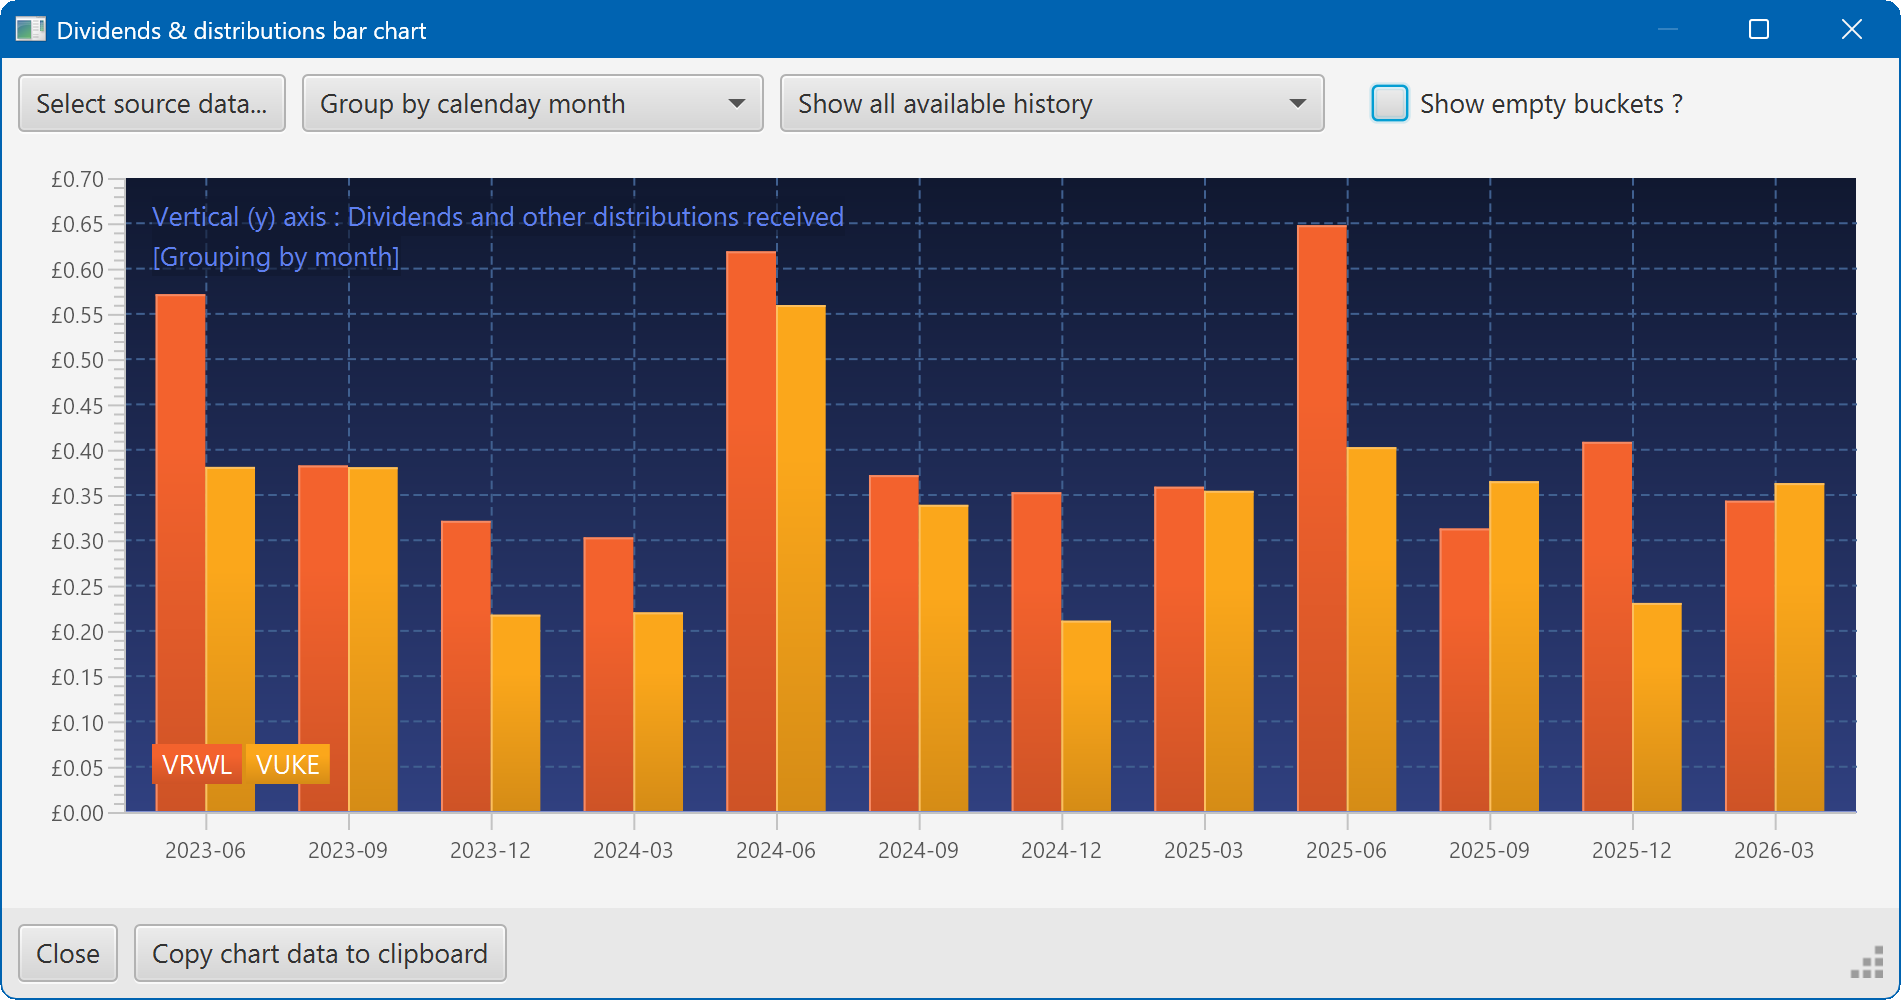
A bar chart showing the dividend history of two securities