
Portly was hand-written by humans (me, specifically) with minimal AI input. For the moment, at least, I believe that nothing beats good old-fashioned human craftsmanship !

Multi-currency support in Portly
As an investor with access to the global financial markets, there's a good chance you already own an asset that's denominated in a foreign currency. Perhaps you're a UK investor who owns a global fund that pays dividends in USD, for example. Or you've paid Euros to buy shares on a European exchange. Portly is able to work in whatever currency(s) make sense for you. It comes pre-configured with a set of major currencies, but you can add as many as you need.
This page takes a detailed look at the various ways in which Portly handles its multi-currency support.
Security prices & dividends
Portly allows you to specify which currency each security is priced in (aka its "quote currency"). You do this using the security editor :
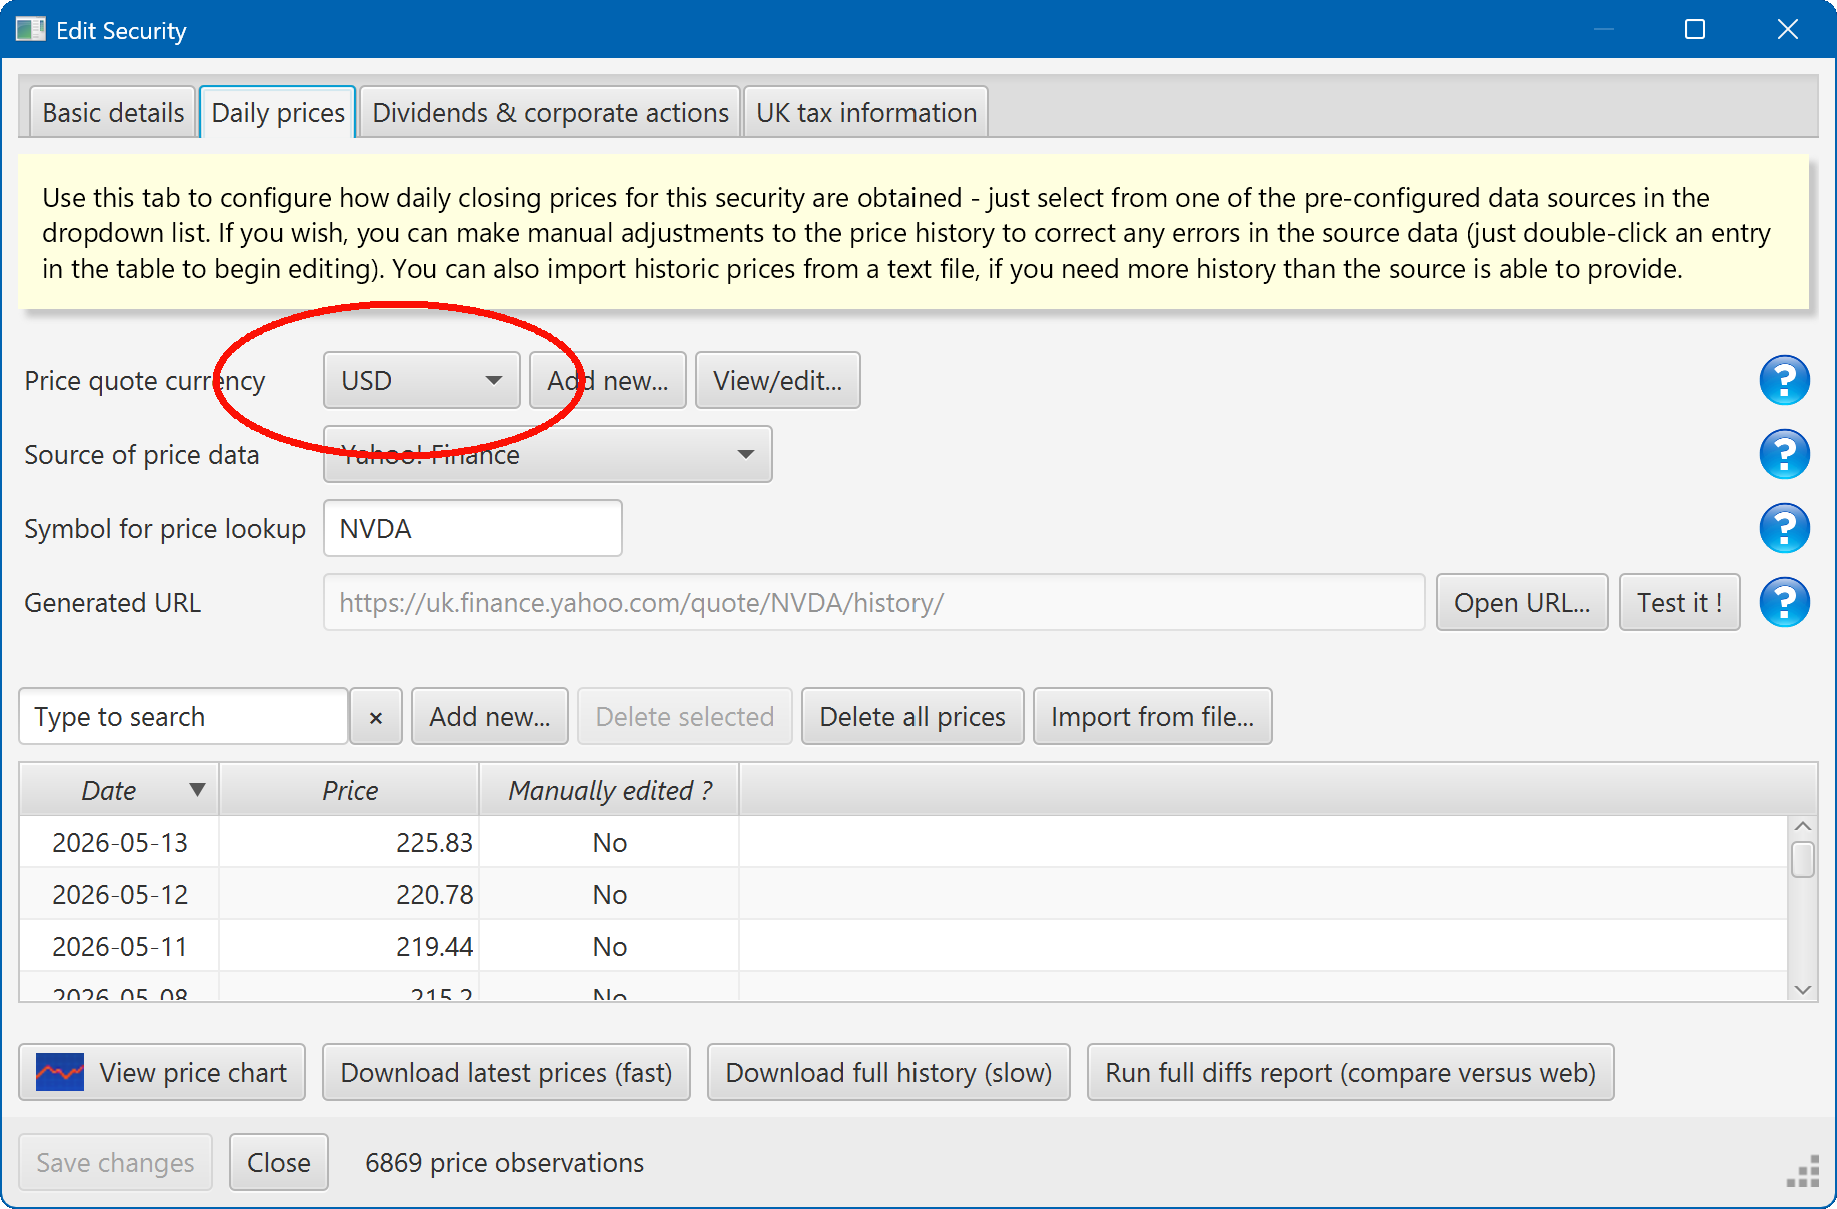
The numbers that appear in the table of historic prices (further down the screen) are assumed to ALL be specified in this same currency.
Dividends can also be specified using whatever currency is most convenient. (One subtle point : when downloading dividends from some third-party websites, the currency of the dividend may not be stated explicitly. In these cases, Portly will assume that the currency of the dividend is the same as the 'quote currency' of the security. This usually gives sensible results, but it's worth checking).
Transaction currency
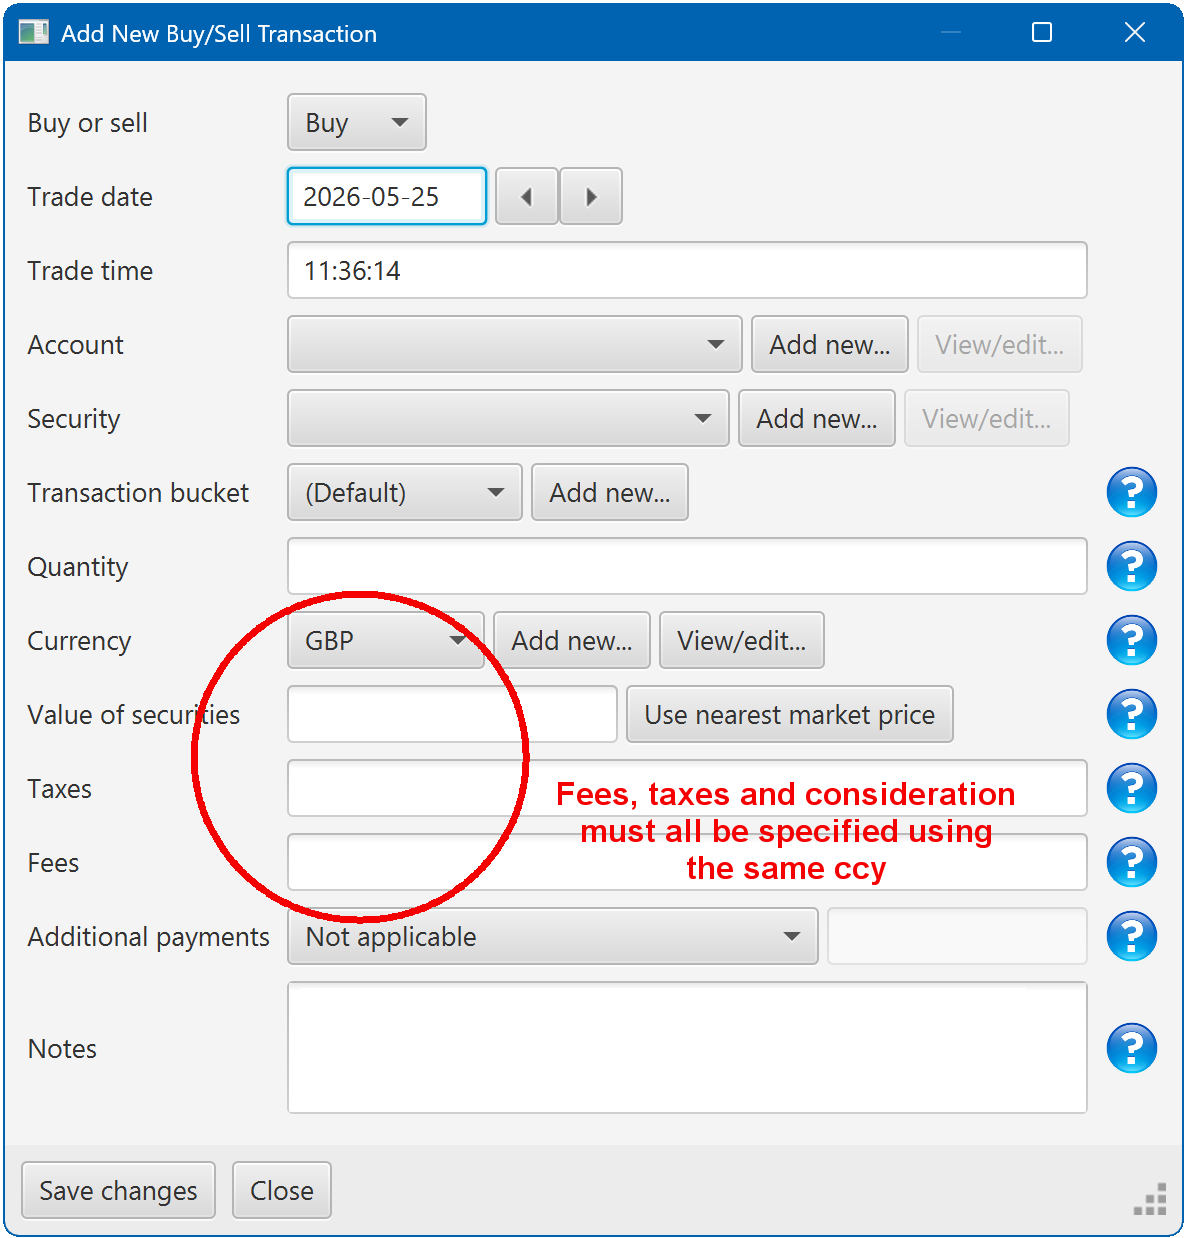
You can enter transactions using whatever currency makes most sense. If you pay USD for a security, enter the amount as USD. Or if you prefer, enter the GBP equivalent amount. It doesn't make any difference to the underlying calculations.
There's one restriction : for something like a buy or a sell transaction, all monetary amounts are assumed to use the same currency. This means that you can't buy shares using USD and simultaneously pay a fee in GBP, for example. In practice I've rarely found this to be a problem, but it's something I might improve in a future release :
A note on cash balances and 'auto fx'
Imagine for a moment that you're a UK-based investor with 100 GBP cash in your account, and you then sell shares worth 900 USD. How much cash do you have at the end of the day ?
Some apps would maintain separate cash balances for each currency - one for GBP, and another for USD. You'd end the day with 100 GBP plus 900 USD, in two separate piles. This approach has some advantages, but it can get complicated because you then need to worry about manually converting from one currency to another.
In Portly, however, the US dollar amount would be automatically converted to Pounds Sterling (using the relevant FX rate) and then added to your GBP cash pile (this behaviour is sometimes referred to as "auto fx").
If a user in Japan entered the same transaction, the amount would be auto-converted to JPY instead. The key point to remember is that you can enter transactions using whatever currency you like - Portly will automatically convert the amount to your 'home' currency to keep things simple.
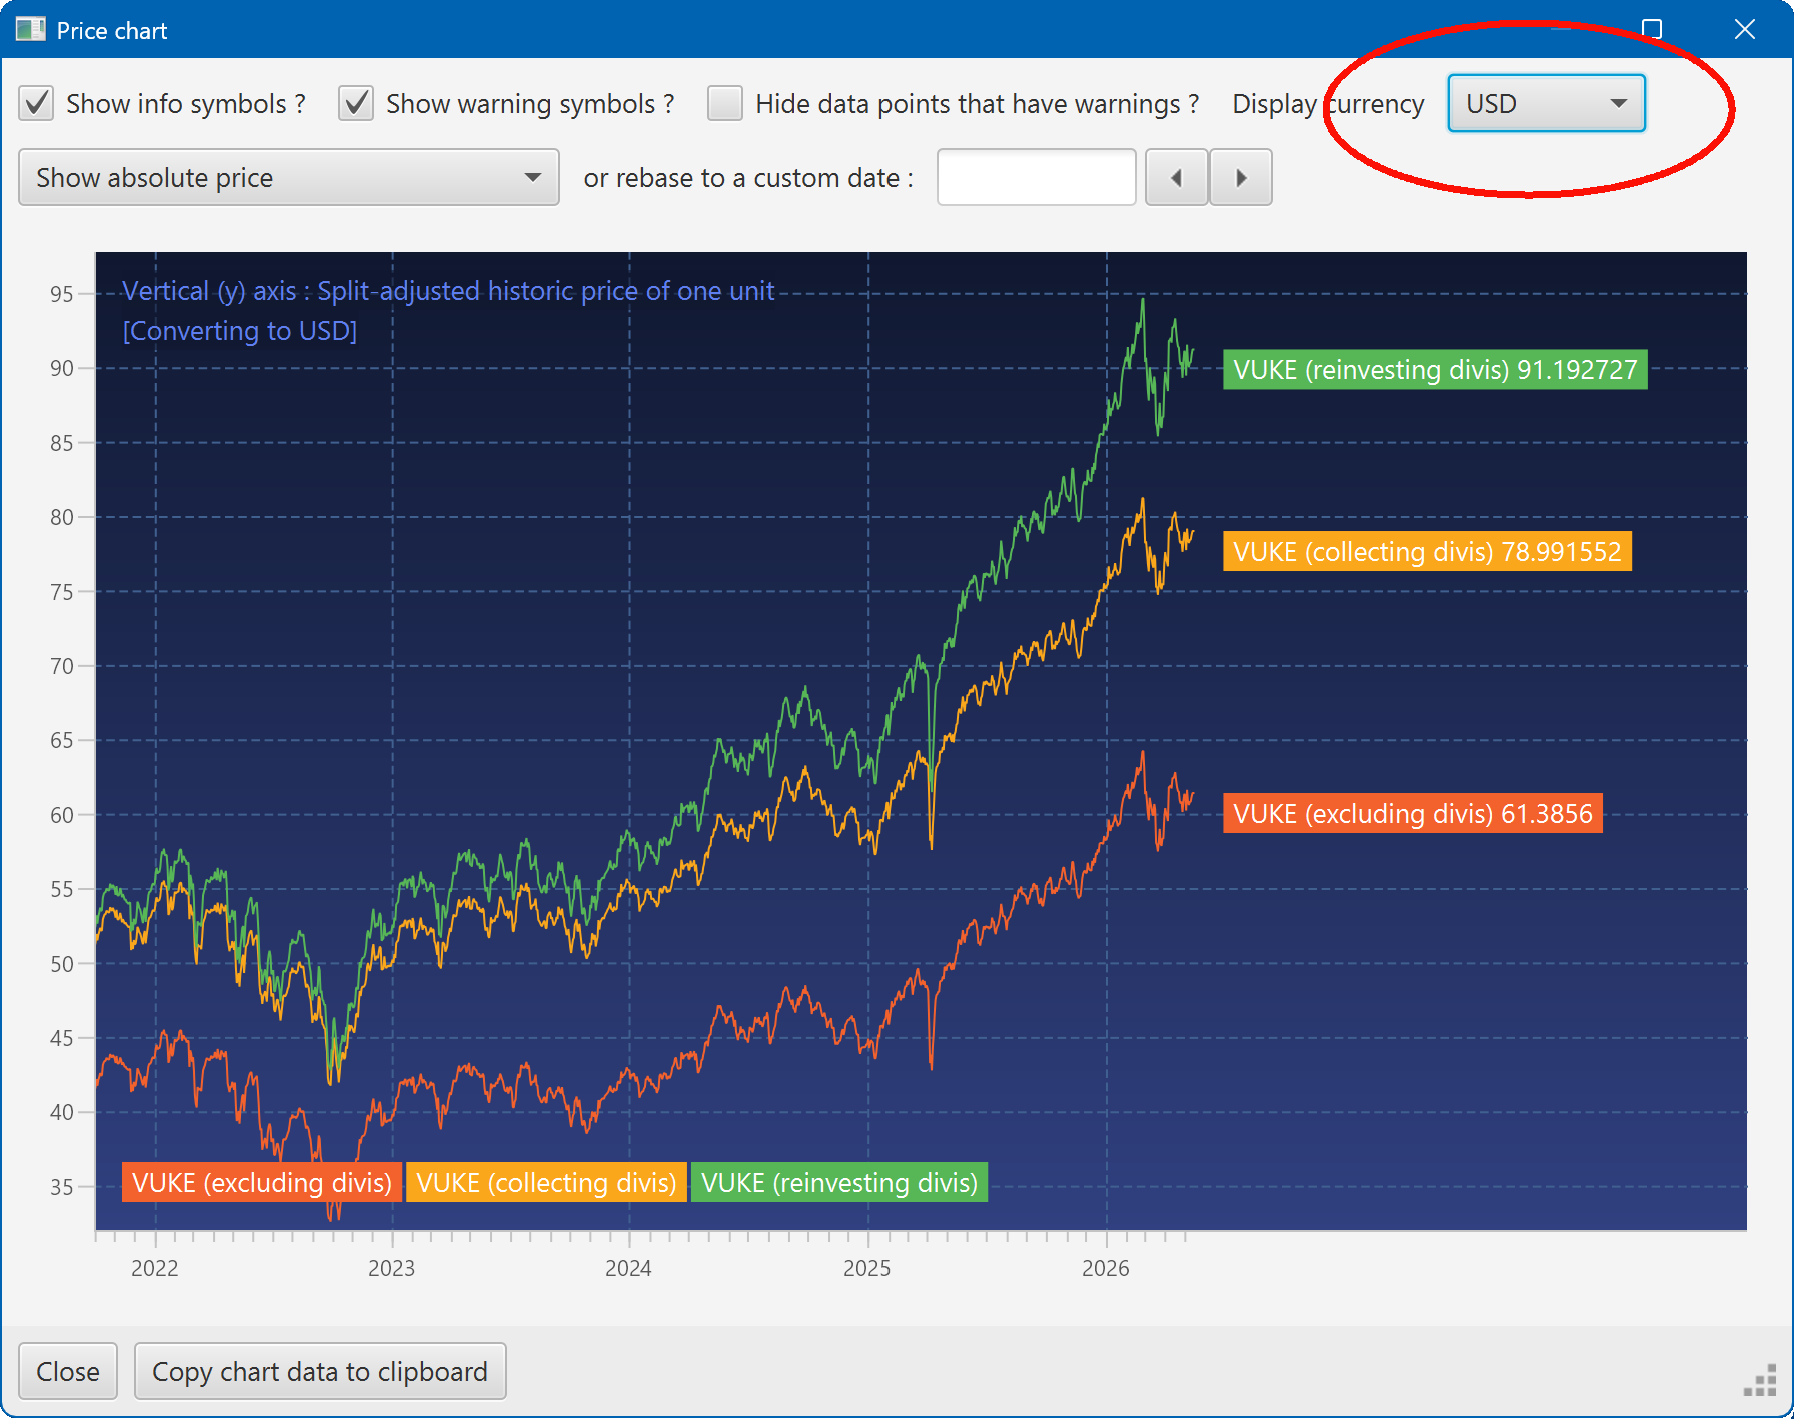
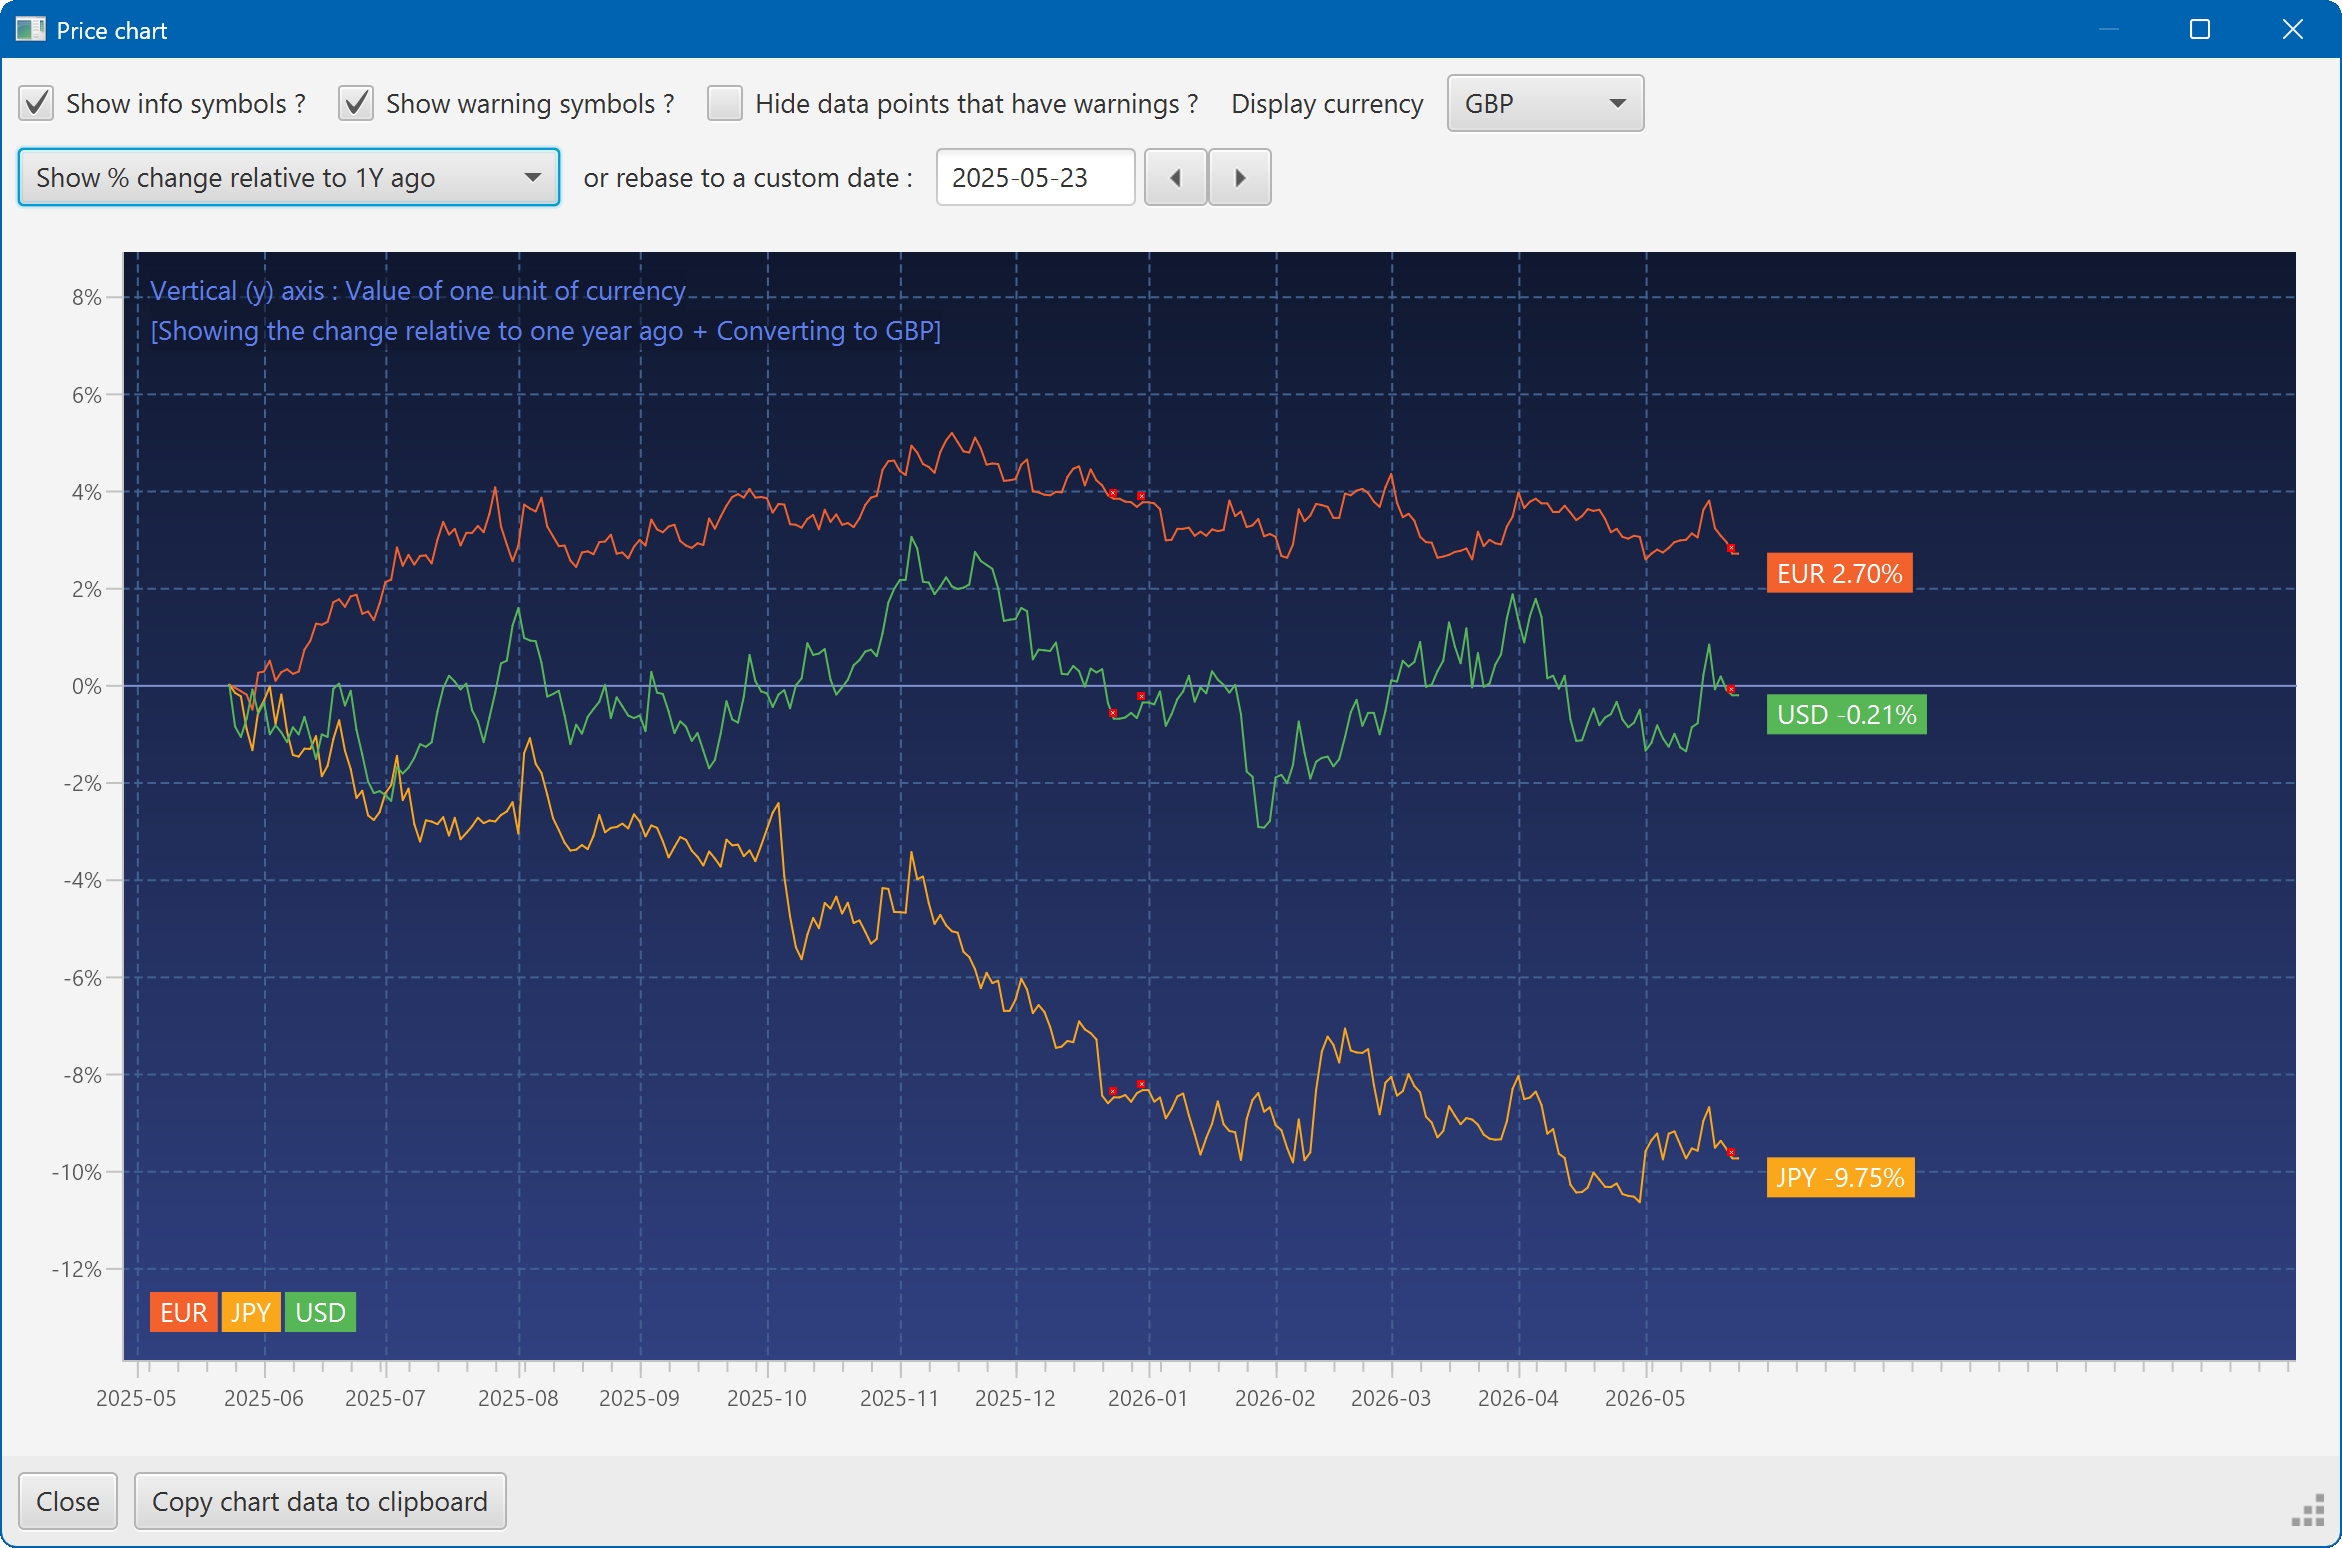
Viewing charts in alternate currencies
Some charts have an option at the top to view the results in different currencies. When looking at a chart of (eg) a security's price, the results will be displayed using your local currency by default. But you can instantly switch between alternative currencies using the listbox at the top of the page :
Adding new currencies
You can add or remove currencies using the relevant link at the left of the screen :
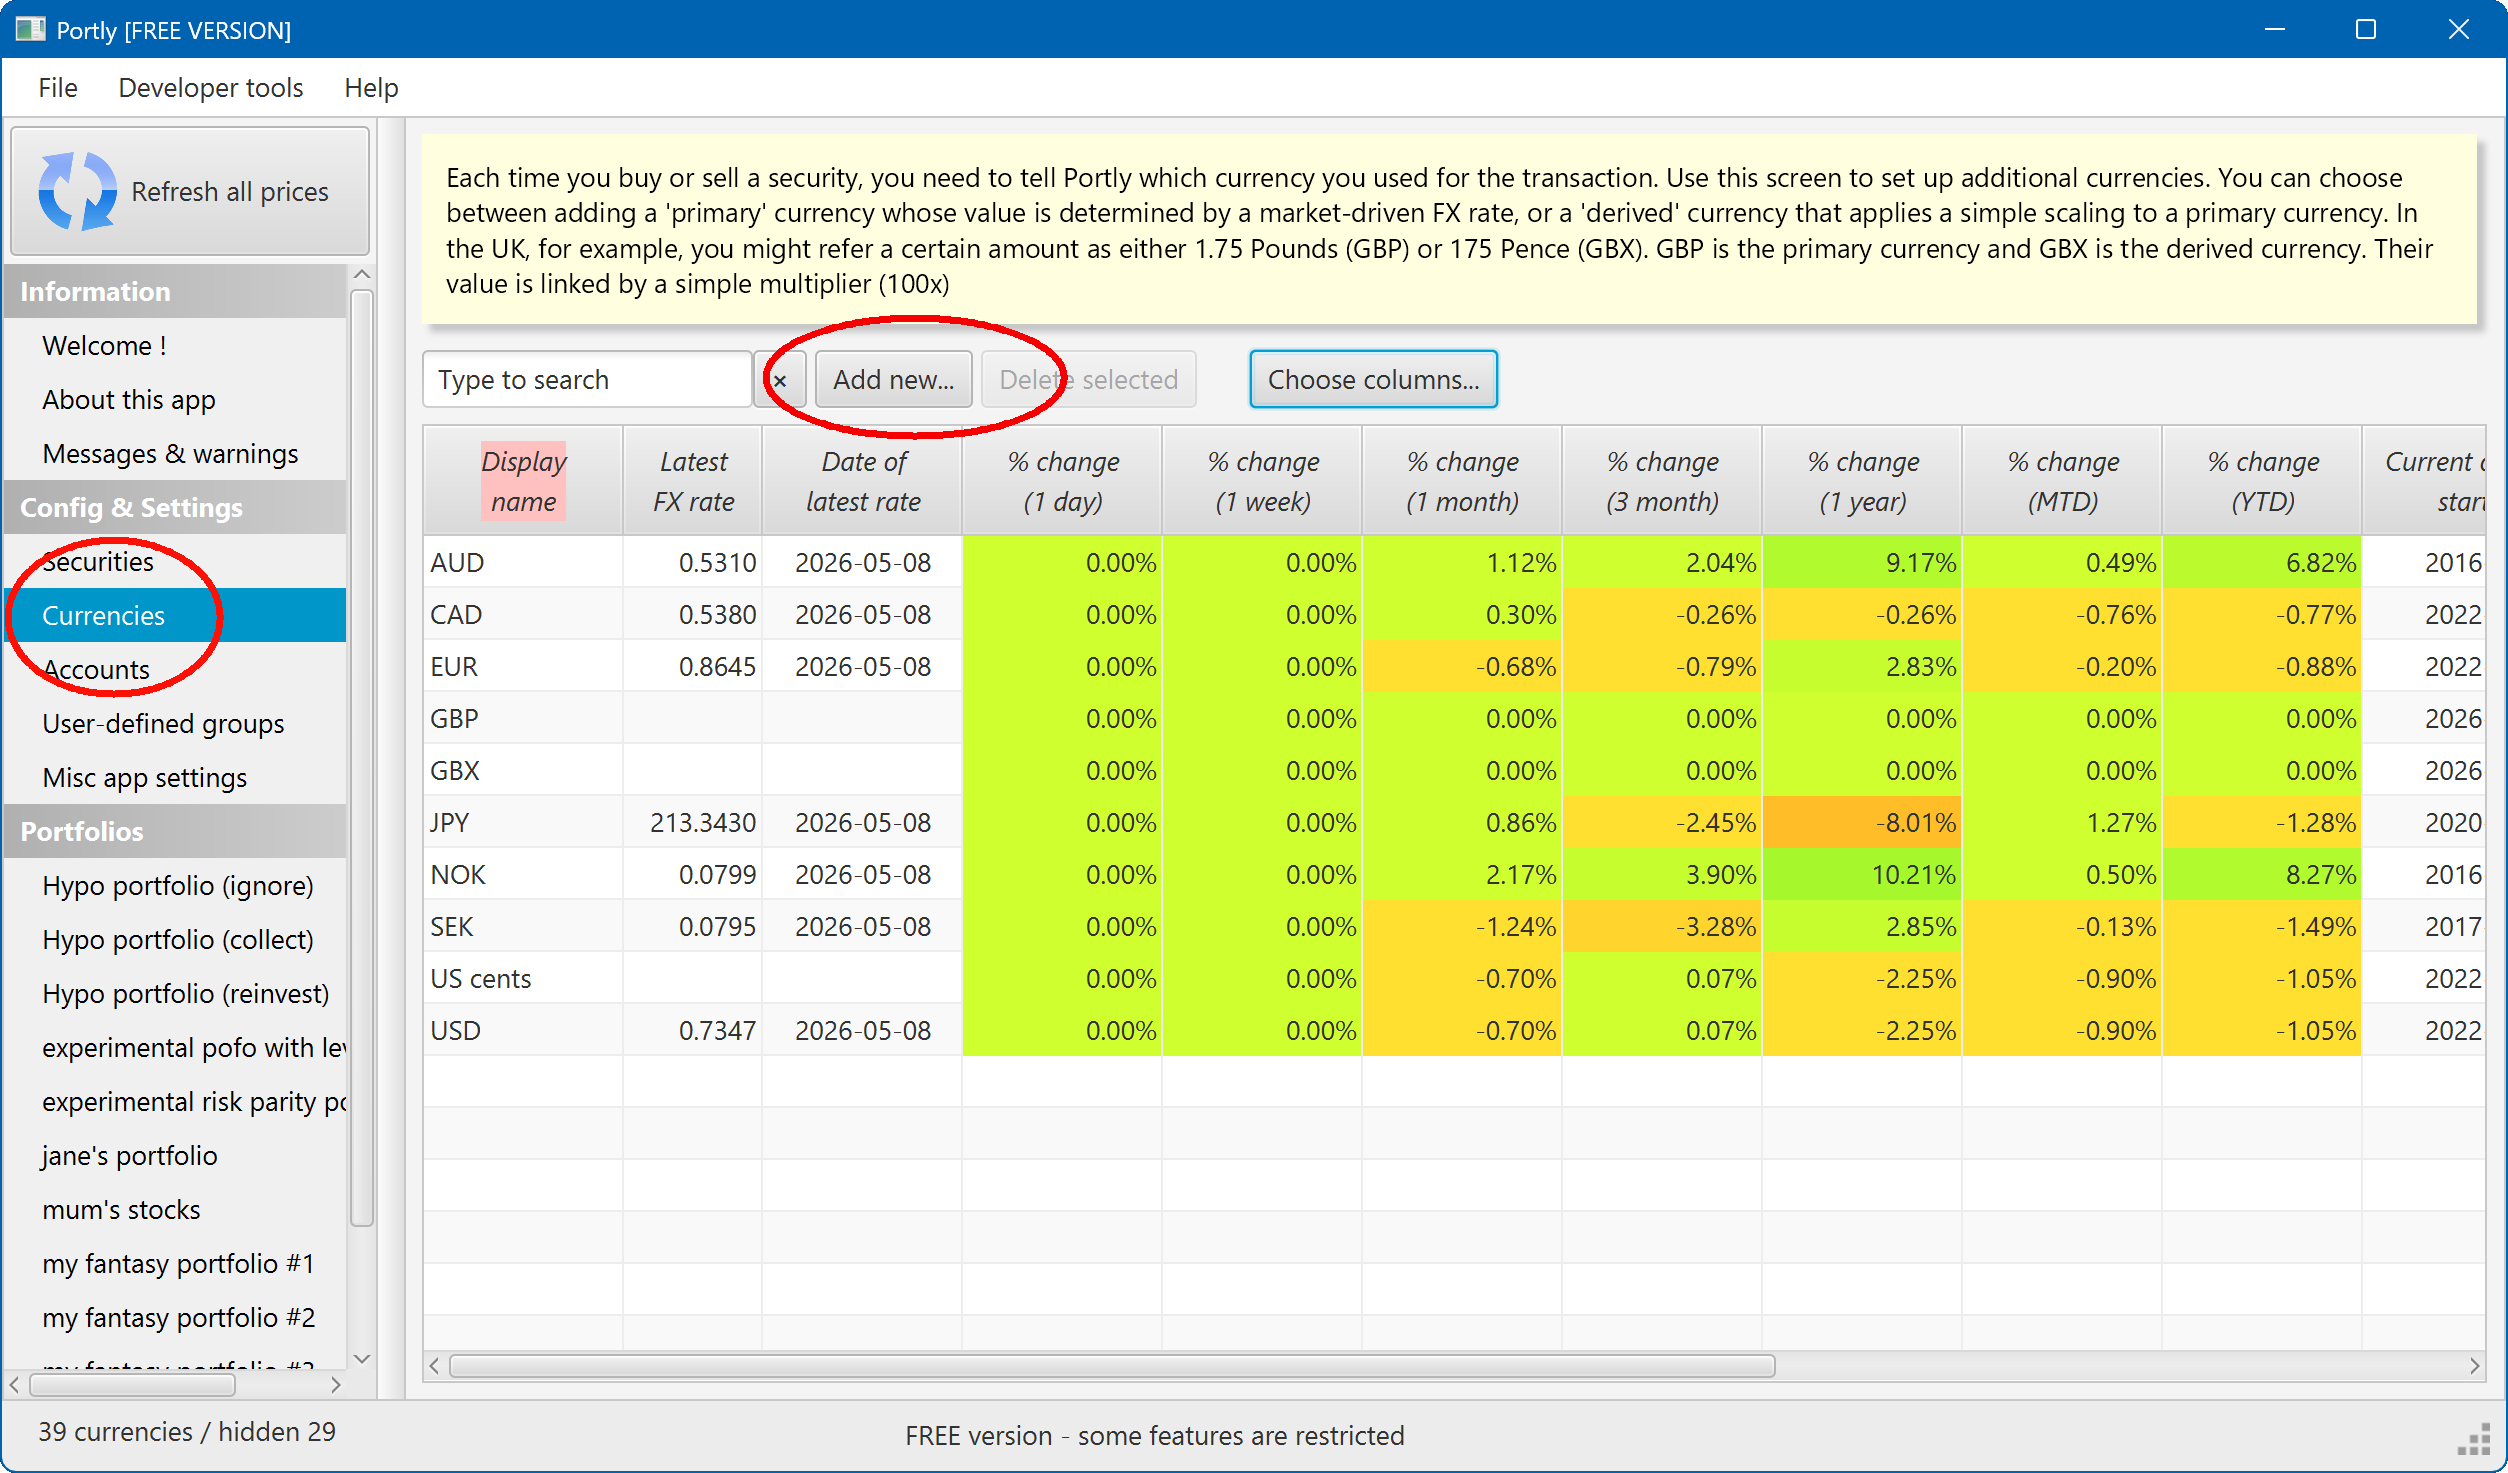
Just press the 'Add new...' button to add a new currency.
This screen also shows you some information about the performance of each currency (its returns over different time periods, its volatility etc). You can plot various charts, too : just right-click on any row in the table for a menu of options. As usual, you can select multiple rows at once (CTRL+left click) to plot several currencies on the same chart :
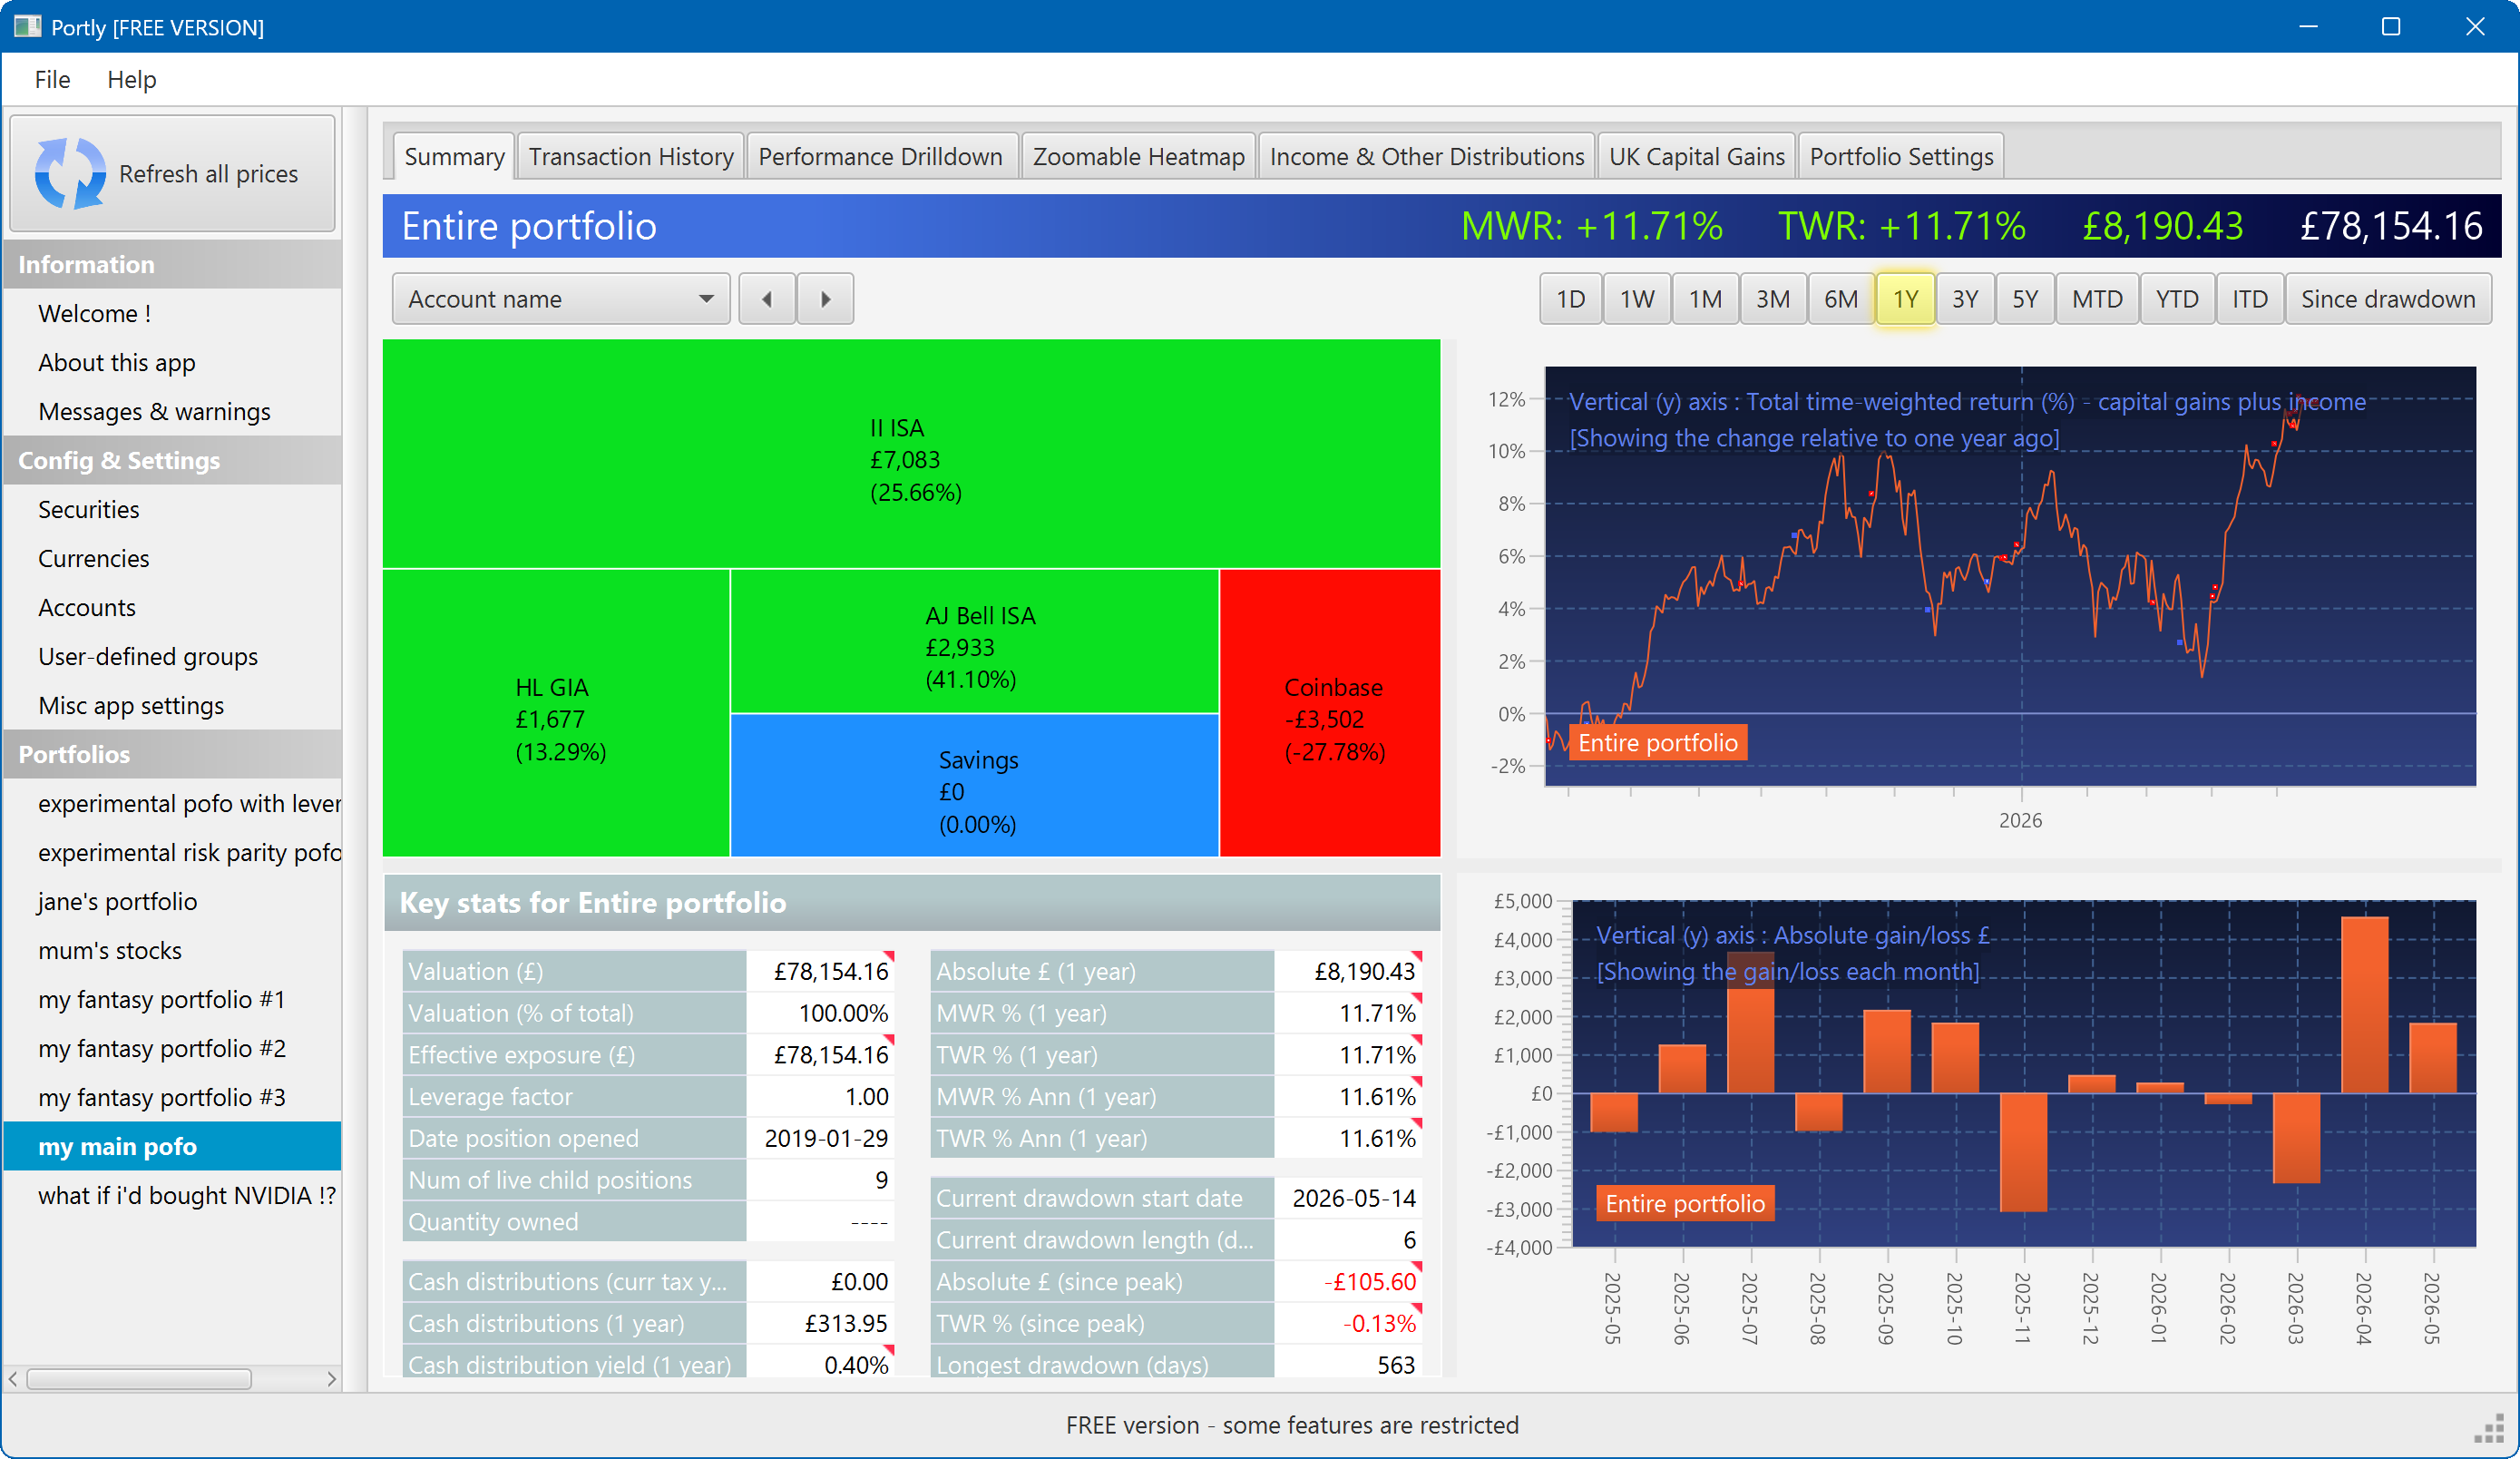
The summary screen gives an at-a-glance overview of your portfolio's performance. To read more about it, click here
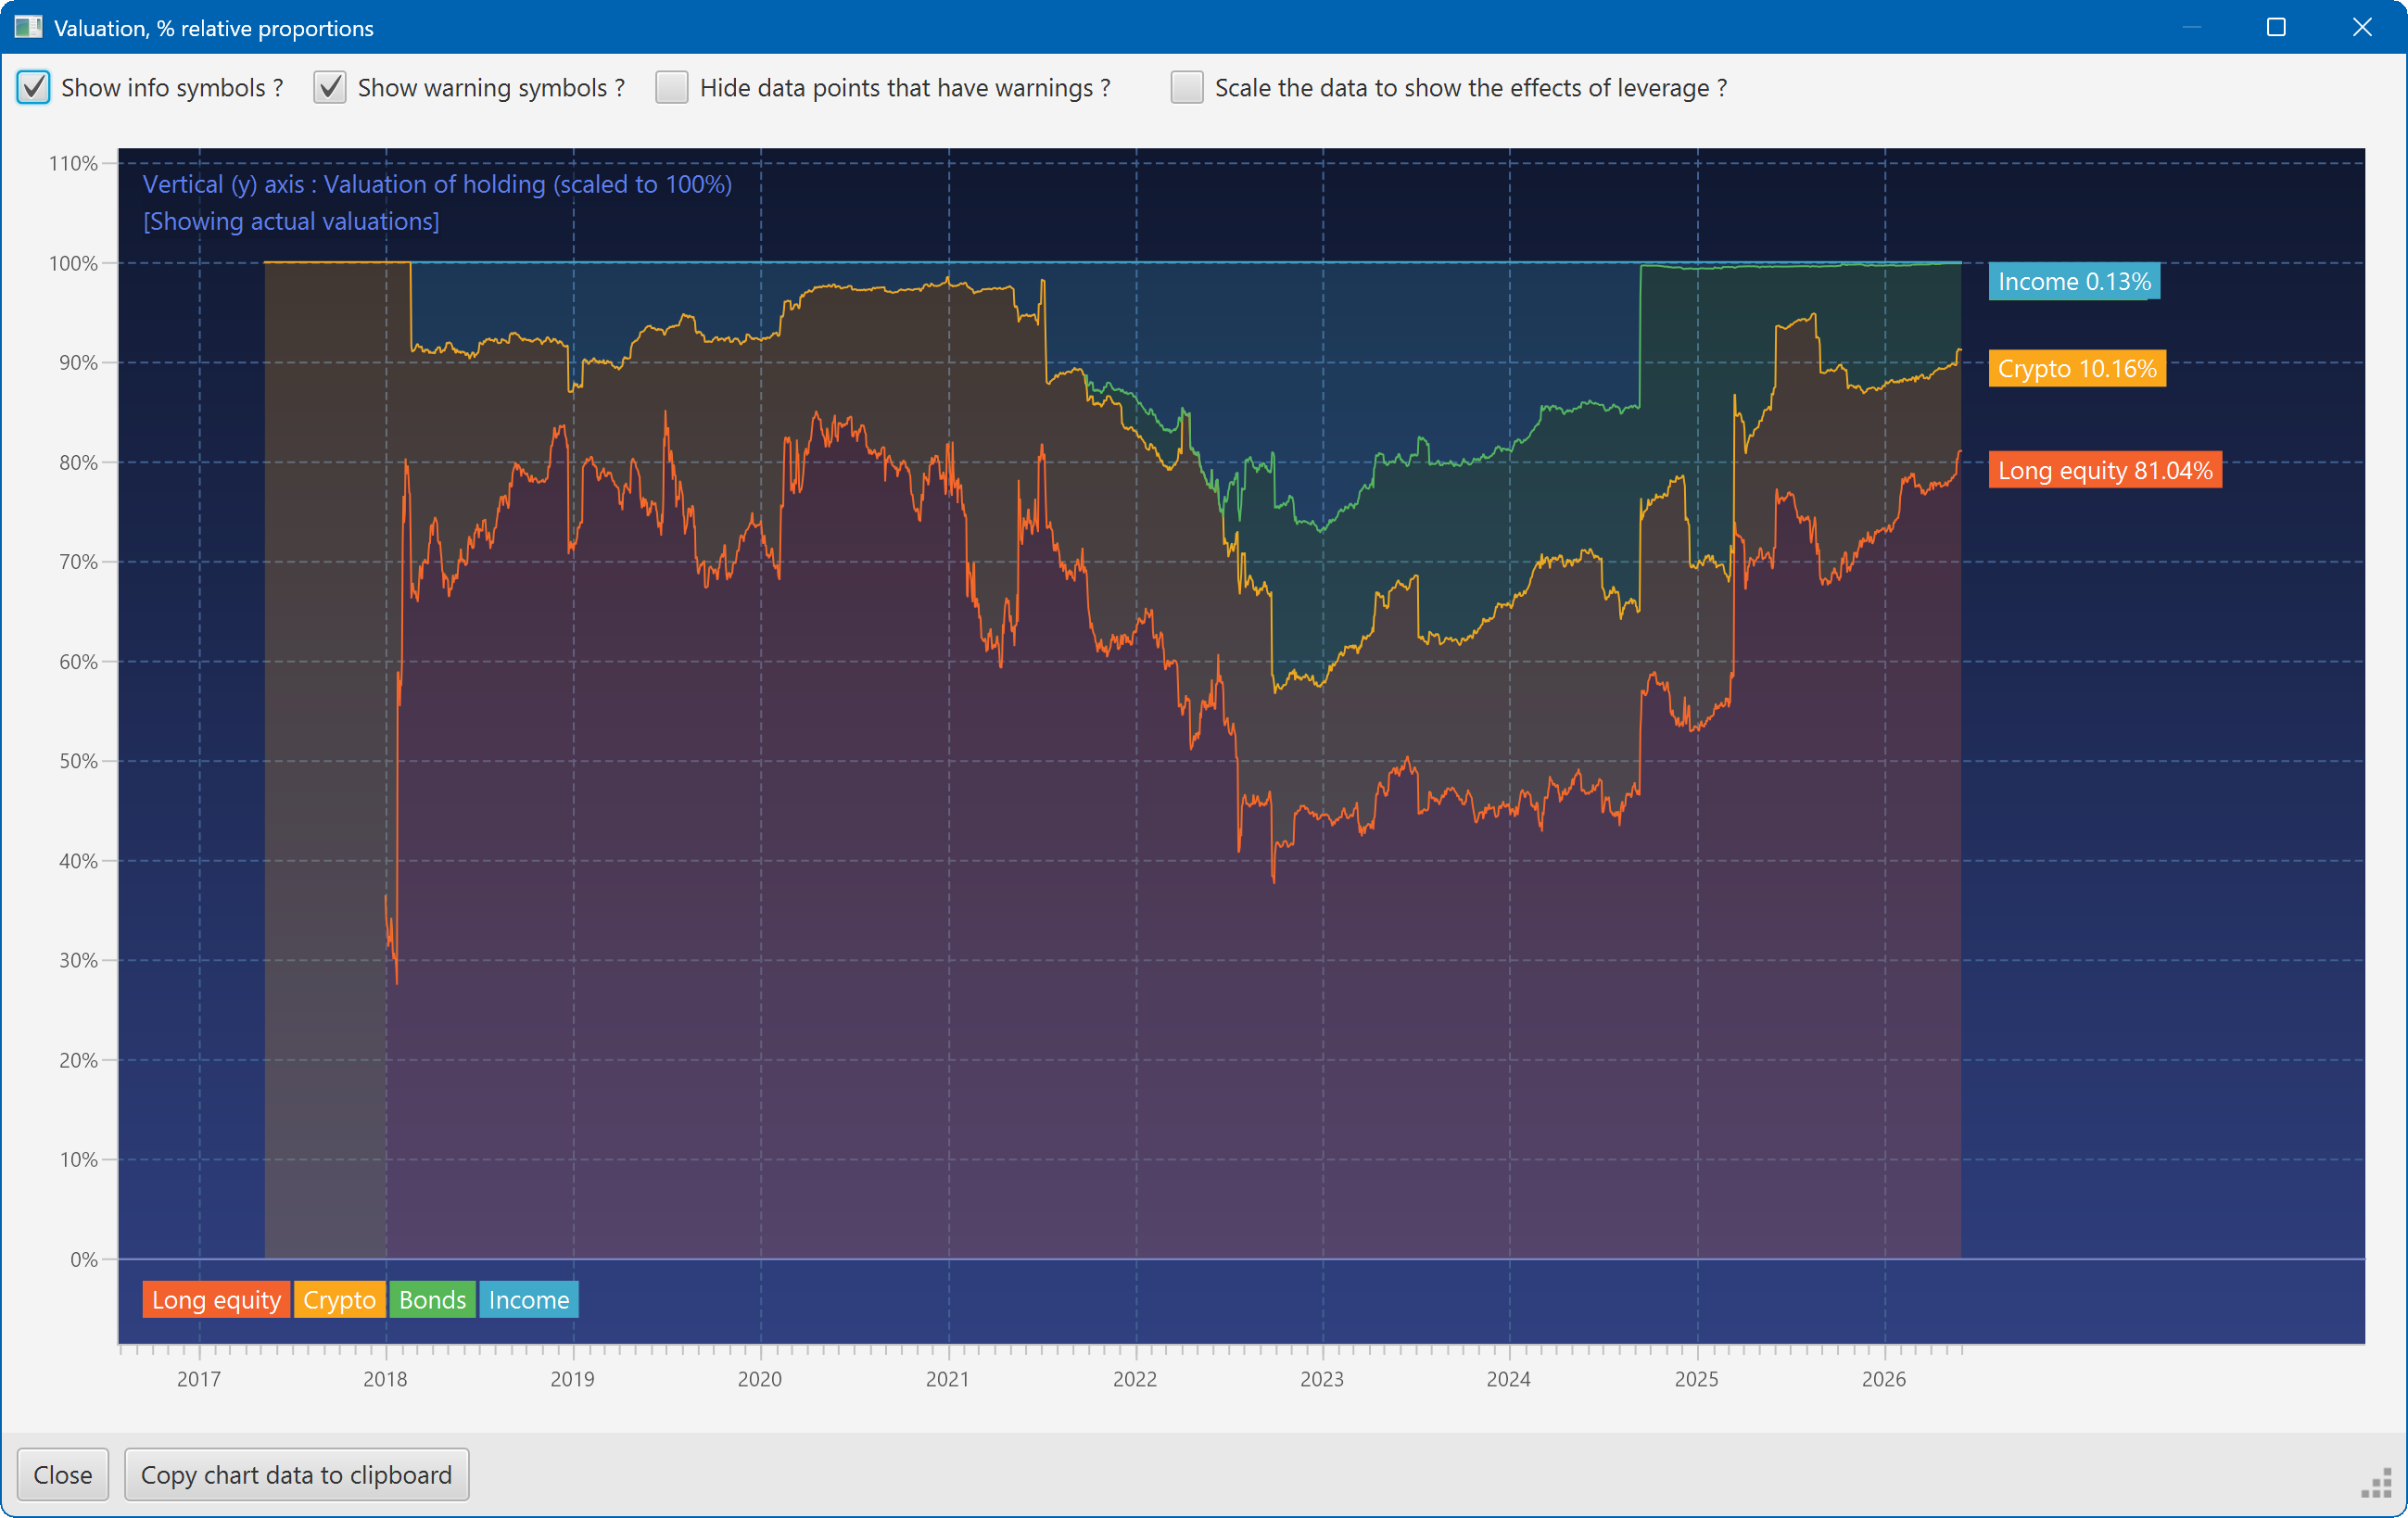
This plot shows the changing composition of a portfolio over time. It uses user-defined groups to organise the assets into different classes.
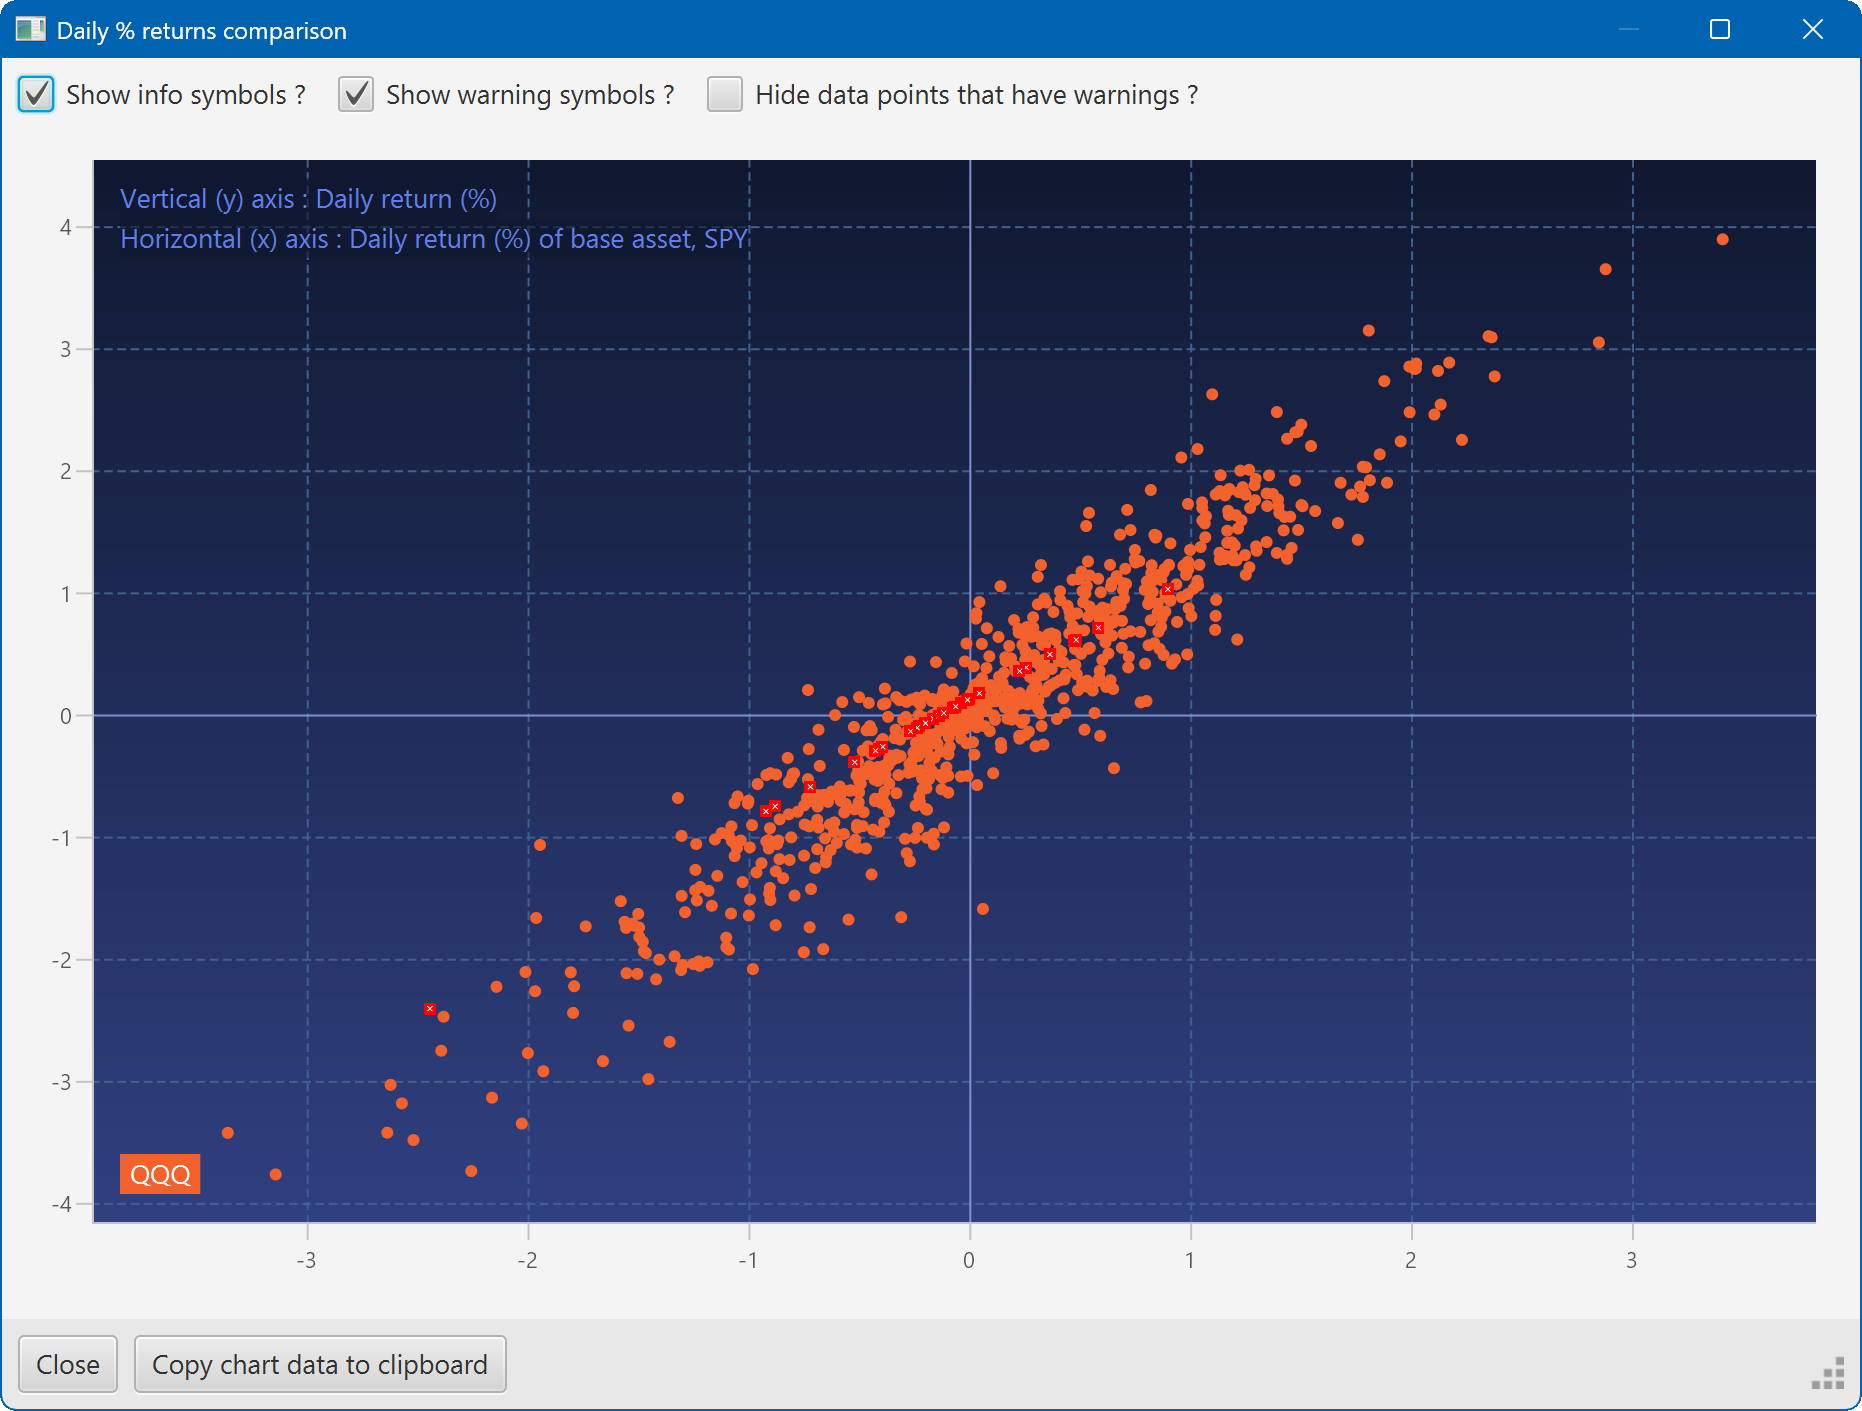
A scatter plot, showing how the daily moves of one security (QQQ) relate to the daily moves of another (SPY)
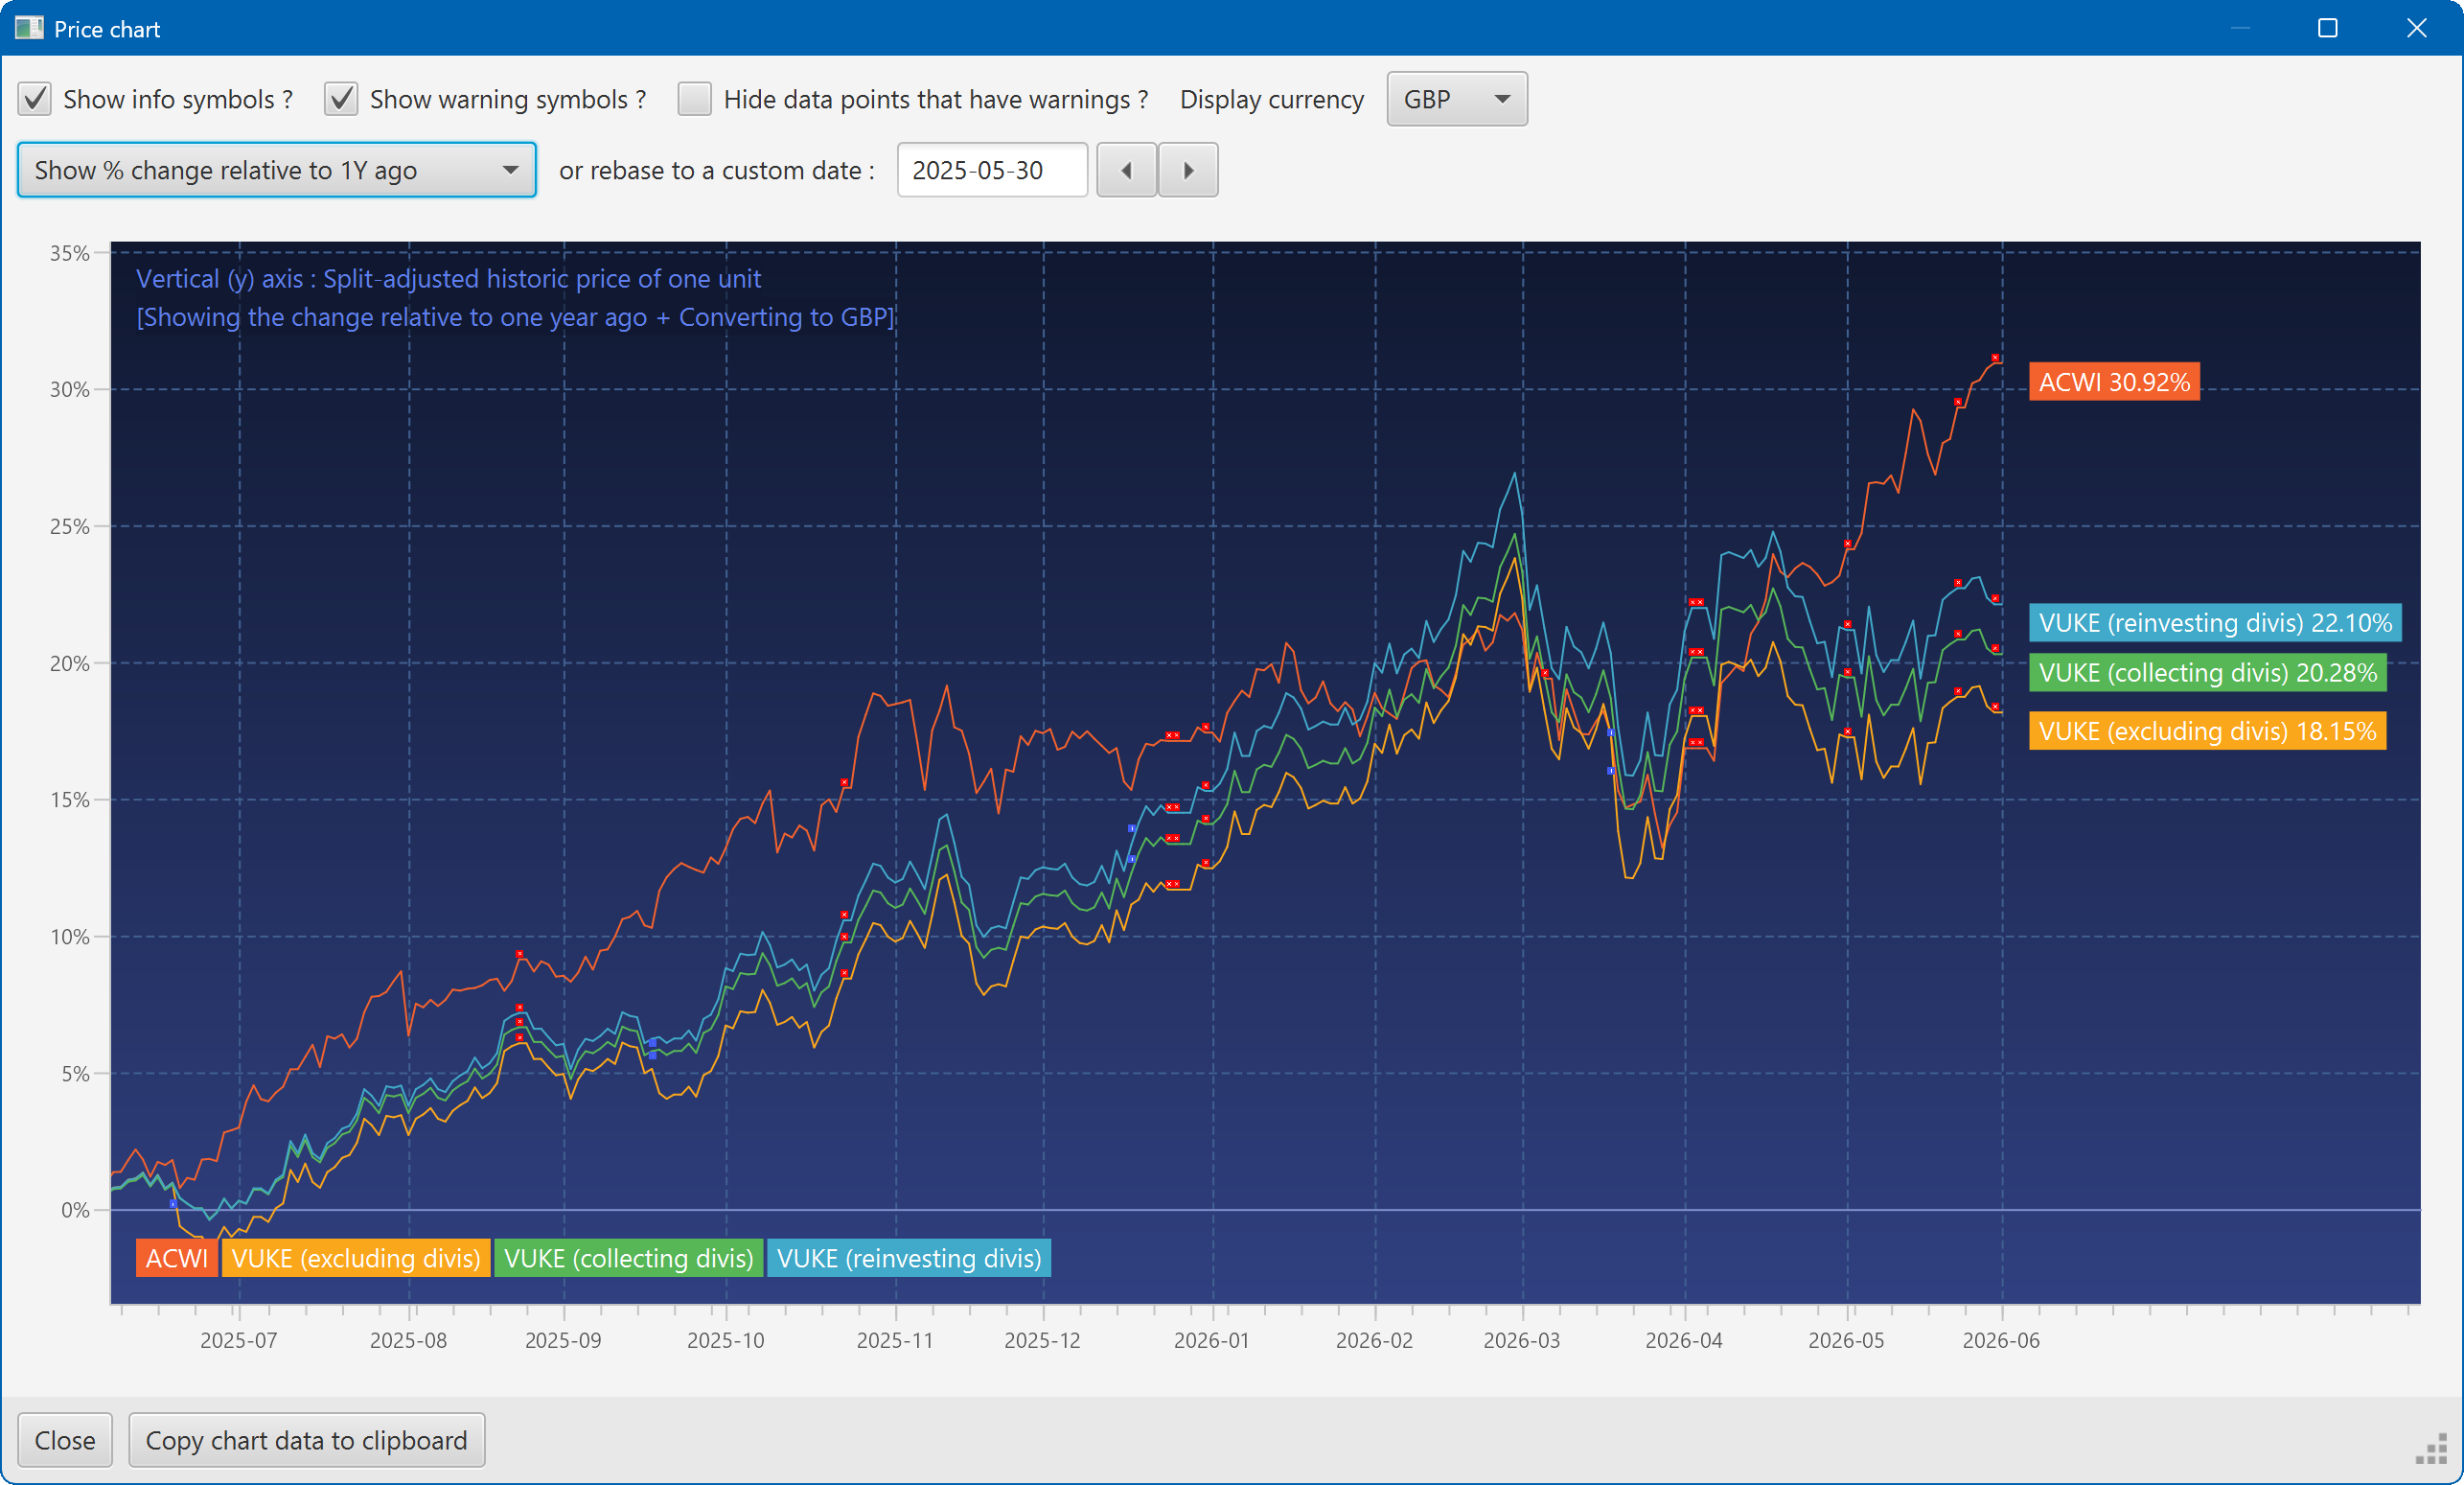
A chart showing the growth of two securities over the past year
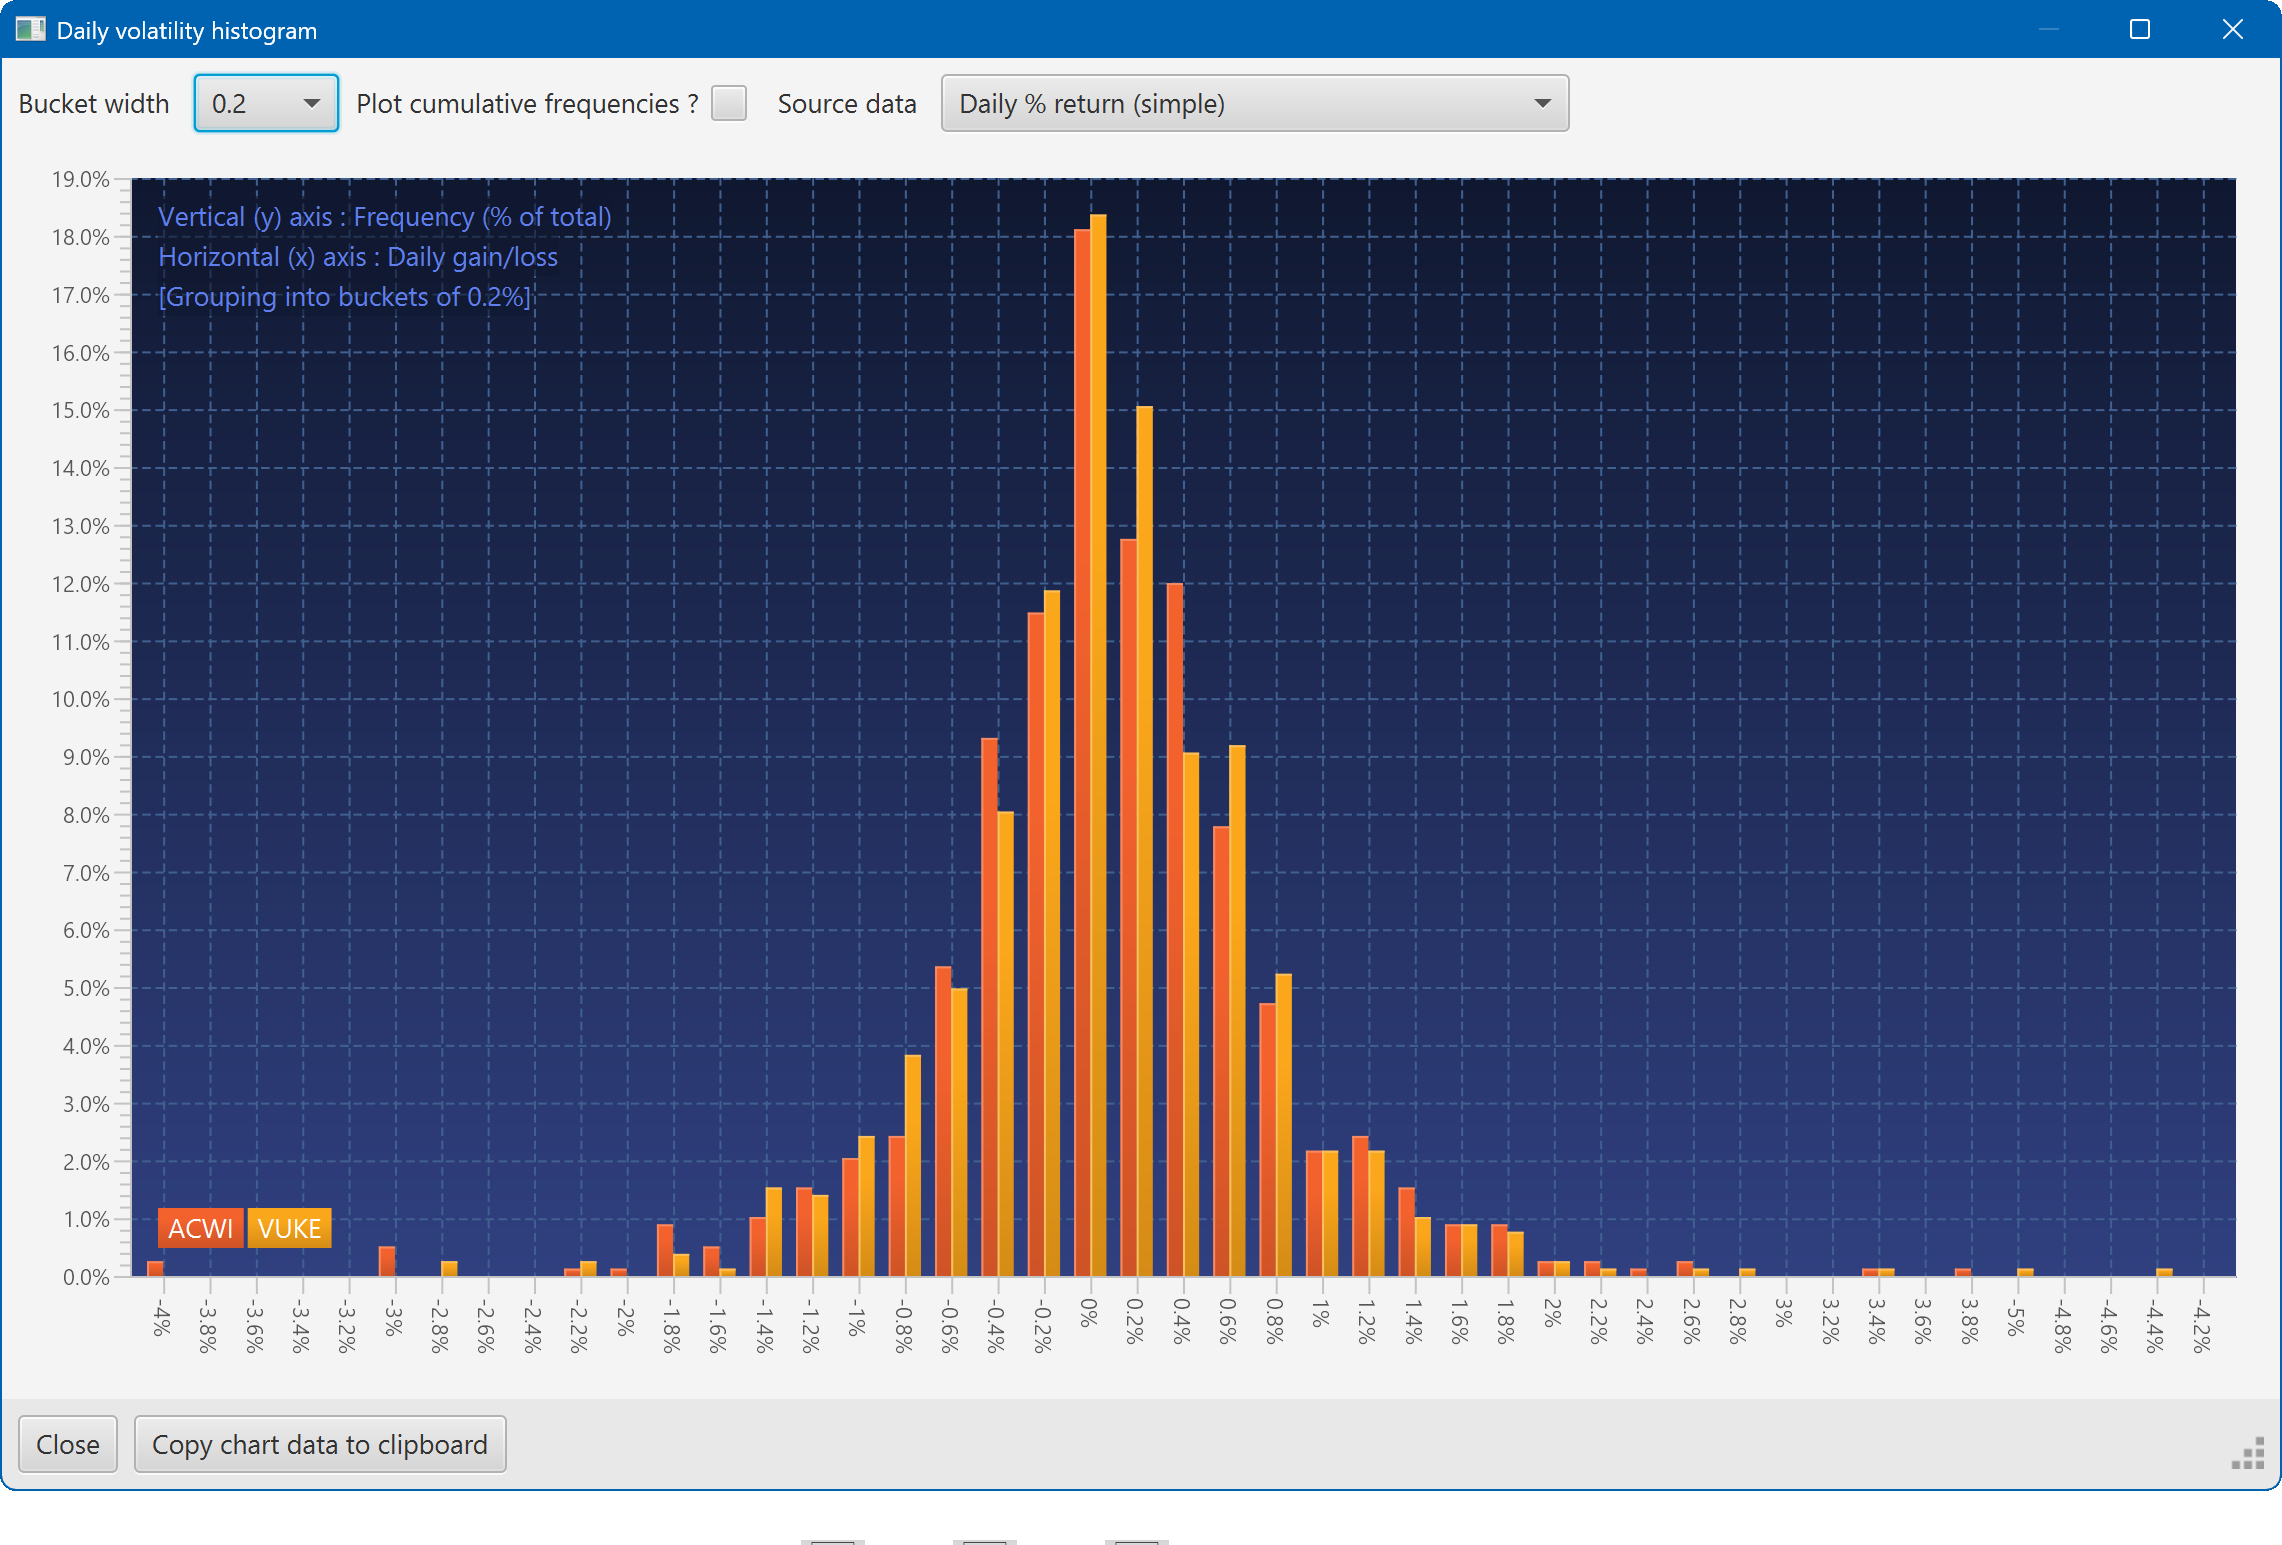
A histogram showing the daily returns of two securities, overlaid
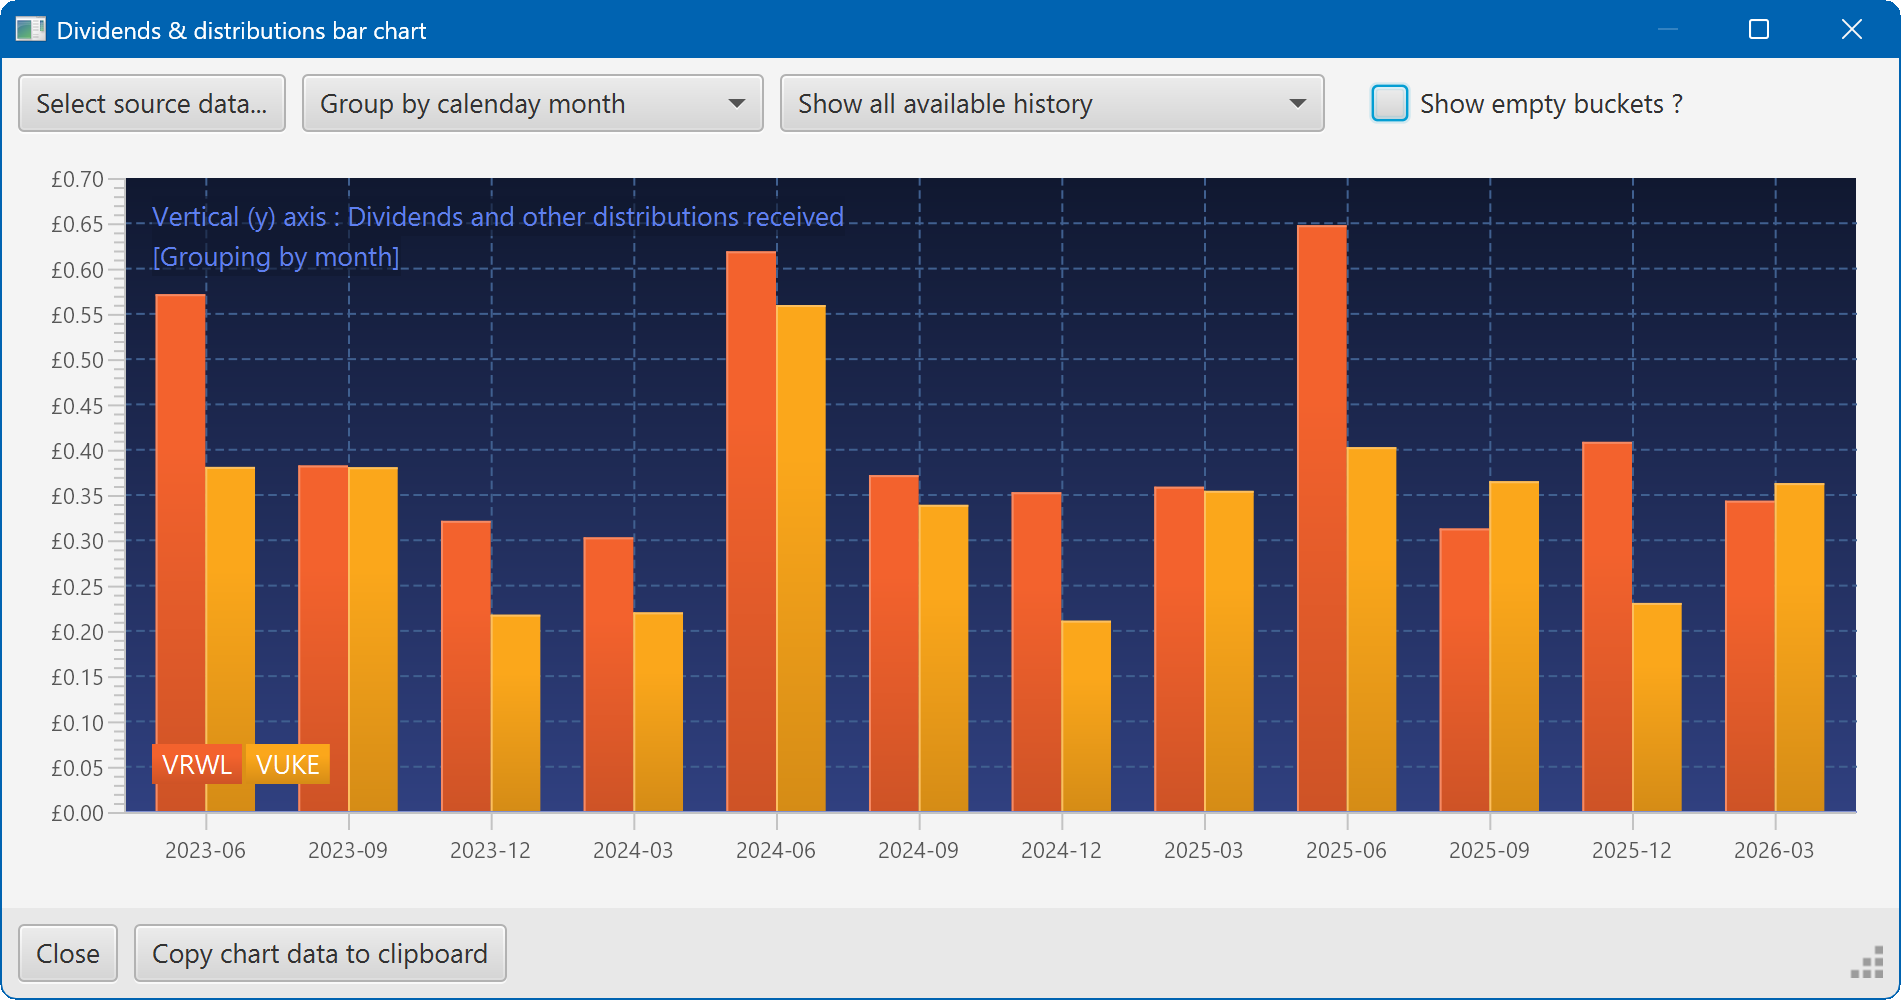
A bar chart showing the dividend history of two securities