
Portly was hand-written by humans (me, specifically) with minimal AI input. For the moment, at least, I believe that nothing beats good old-fashioned human craftsmanship !

The income report
Portly keeps track of all the income you have earned from your investments, whether that's in the form of interest, cash dividends, stock-based dividends or even more esoteric stuff such as accrued interest adjustments and equalisation payments. For UK users, this is particularly useful when you're filling out the 'income' pages of your Self Assessment return.
You can find the relevant information on the 'Income & Other Distributions' tab :
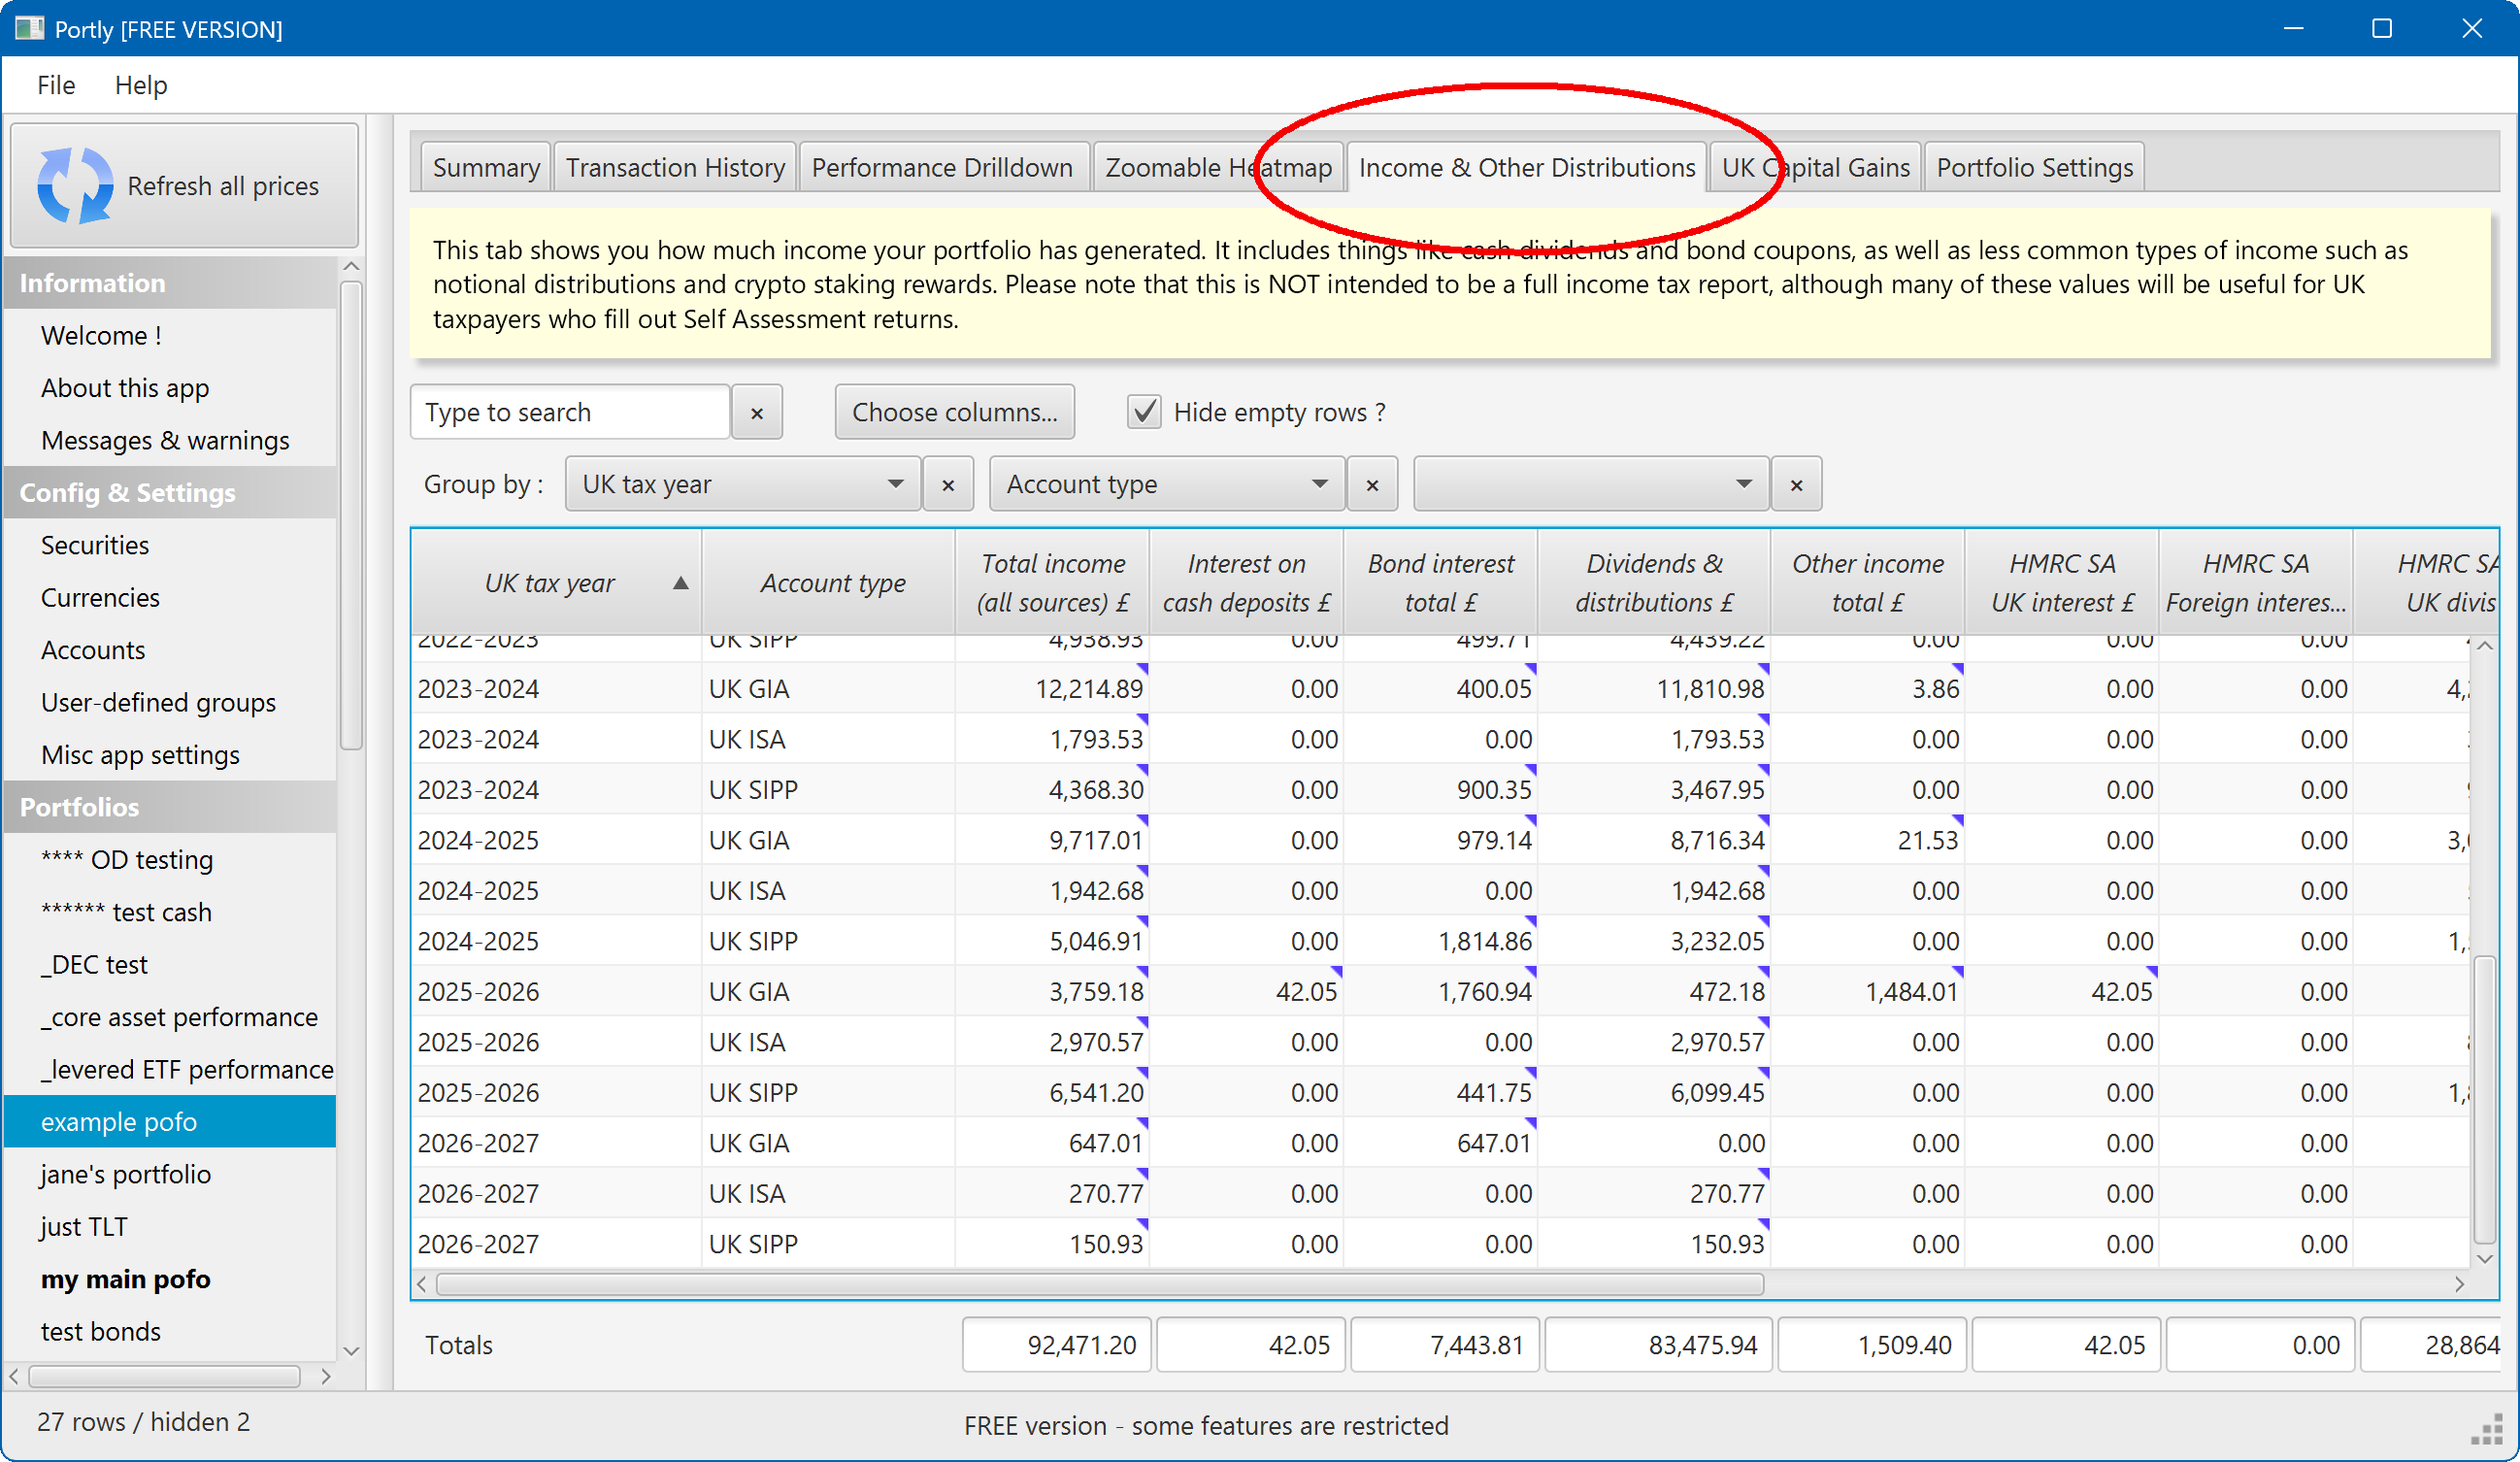
This screen functions a lot like the performance drilldown screen. The key difference is that you're able to split the portfolio by time - enabling you to see the income earned during each unique calendar year or tax year, etc (there's also a different selection of columns that can be added to the report).
Note that all amounts in the report are shown in your local currency - any foreign-currency amounts are automatically converted using the relevant FX rate.
Many of the cells in the table have a small blue checkmark in the corner. If you hover your mouse over one of these cells, you'll see details of all the individual transactions that contributed to the reported amount :
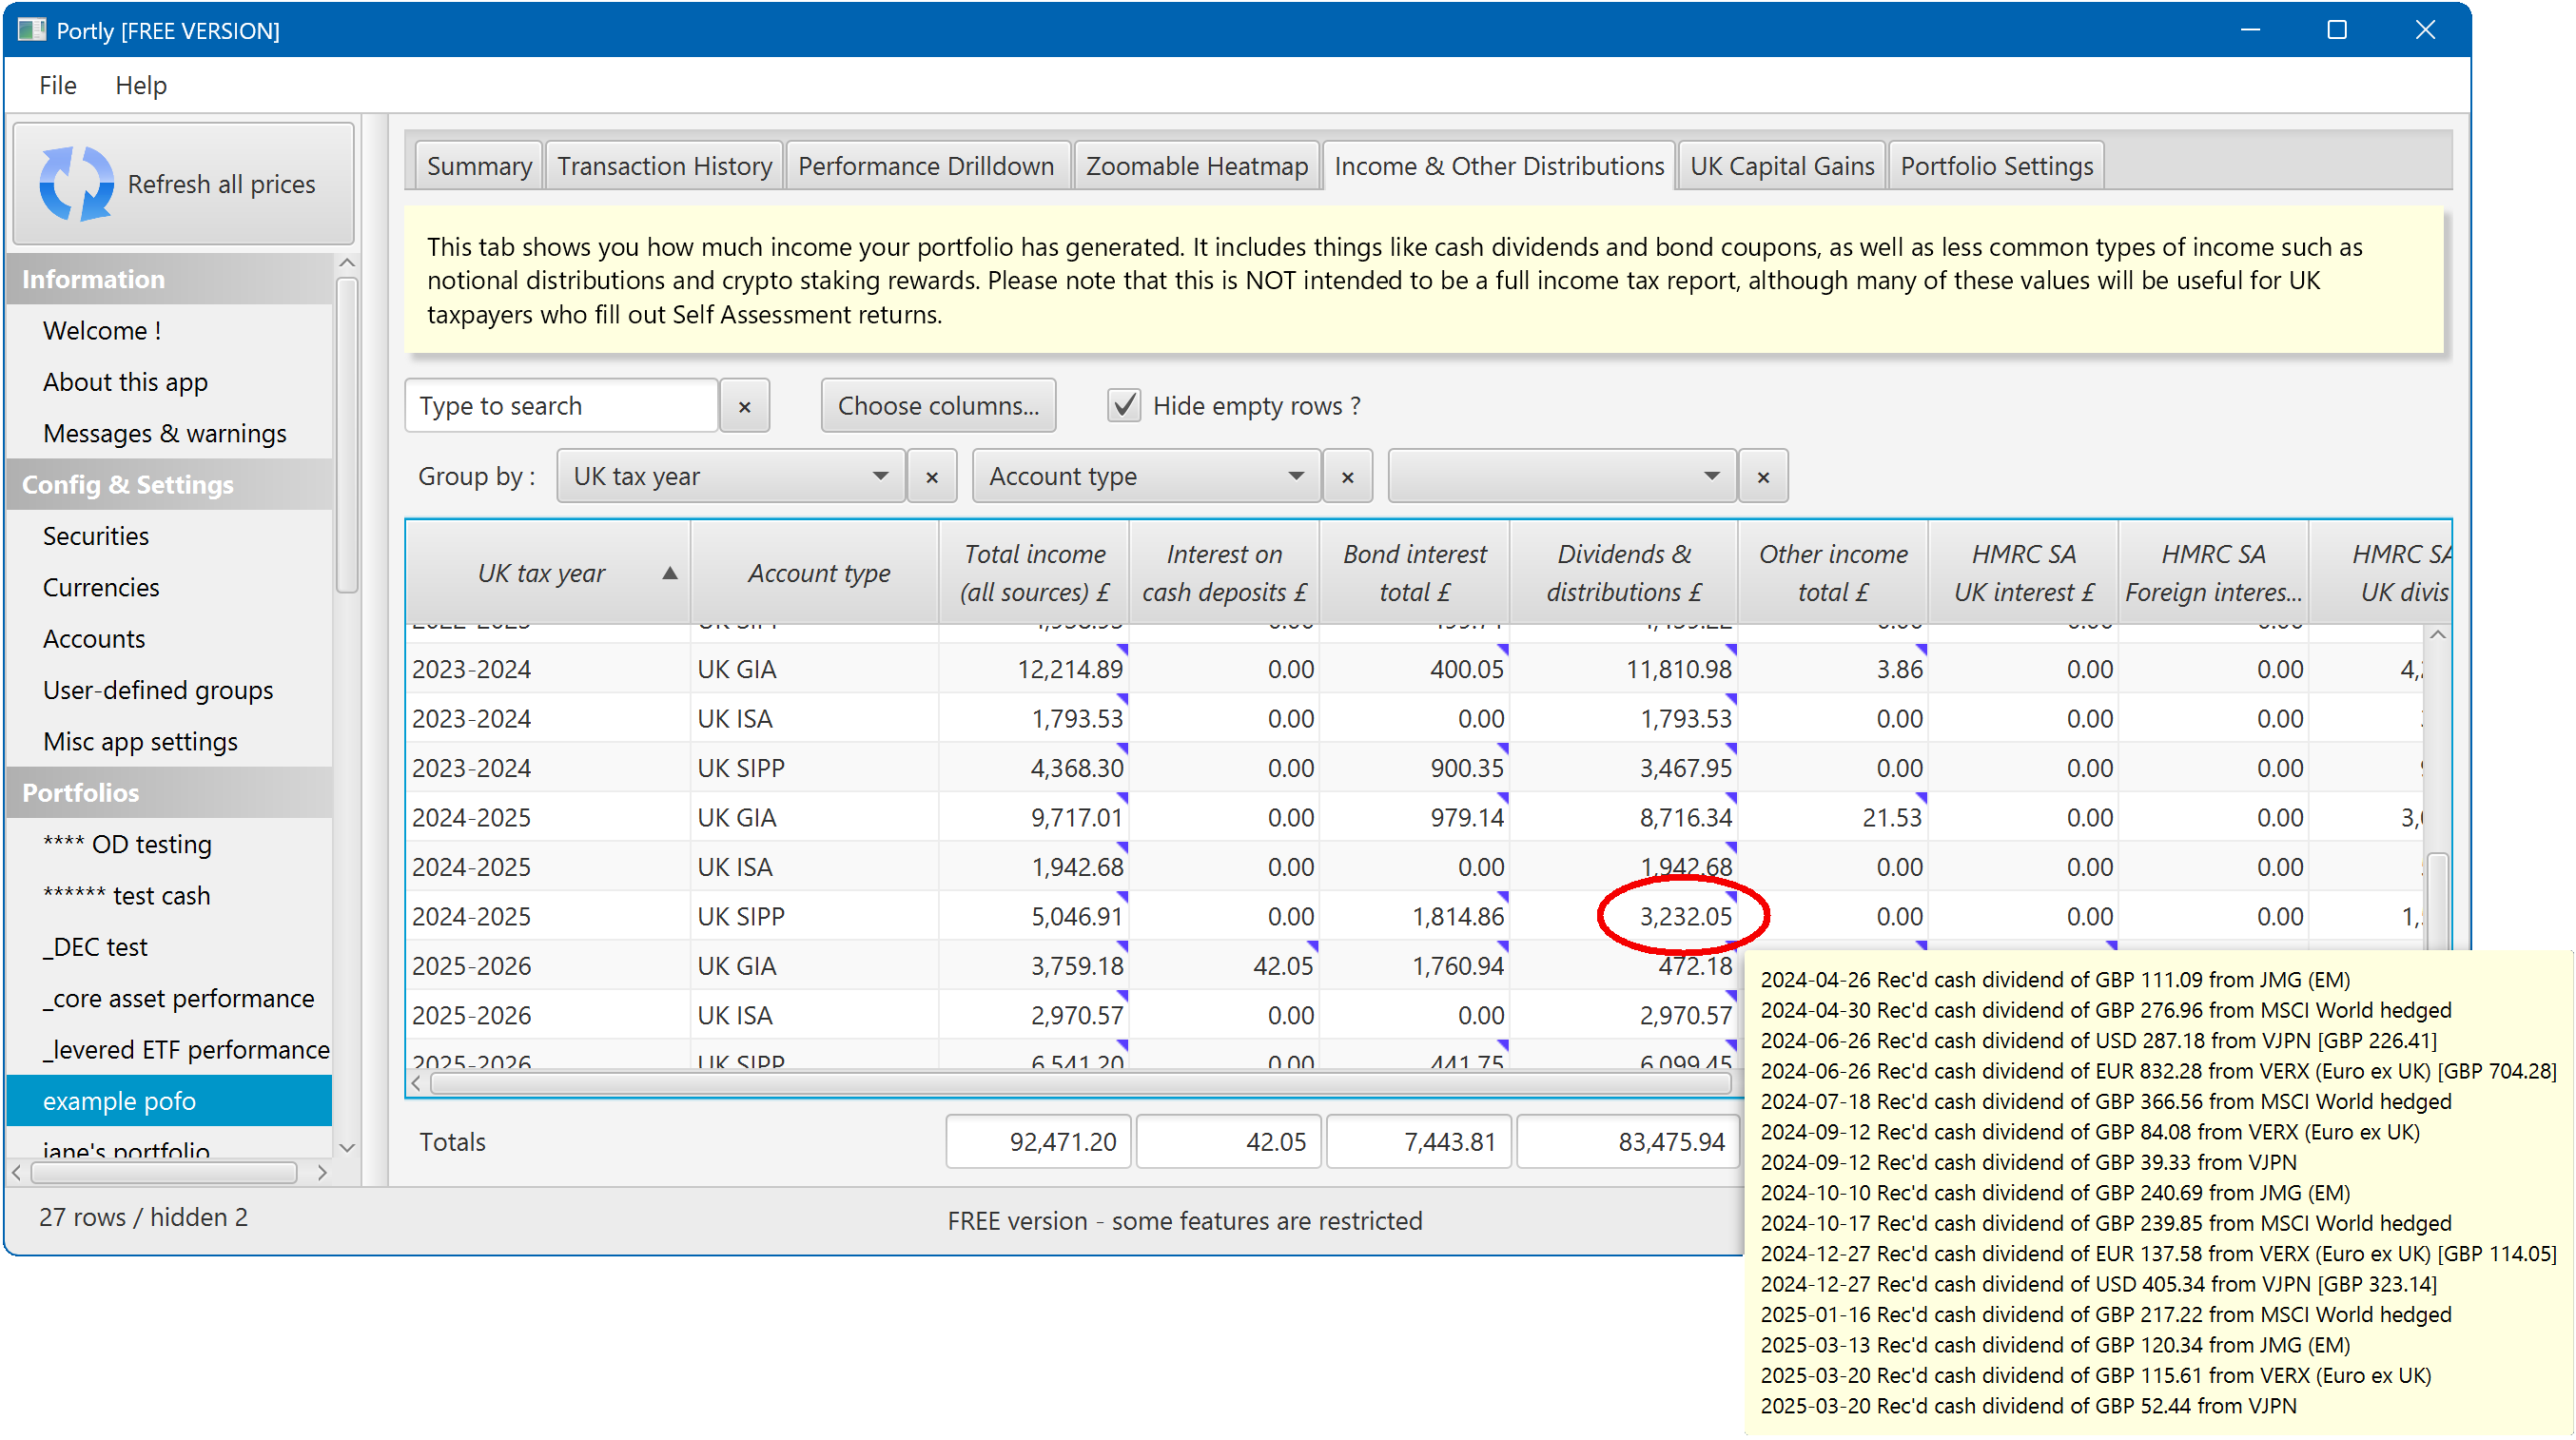
If you need more detail, you can right-click on any cell and choose "Jump to underlying transactions..."
Notes for UK taxpayers
When filling out a Self Assessment tax return, it can sometimes be challenging to work out exactly which box should be used for reporting each type of income. For example, interest from savings is reported in one box, but interest from bonds is reported in another (and interest from bond funds in yet another !) Dividends from UK companies are reported in a different place than dividends from foreign companies, etc.
To help, Portly has a series of columns that map directly to the UK Self Assessment report. You can find these under the 'Choose columns...' -> 'UK Self Assessment tax reporting' menu. The UK-specific columns have names like 'HMRC SA {something}'. If you add them all to the report, your screen will look something like this :
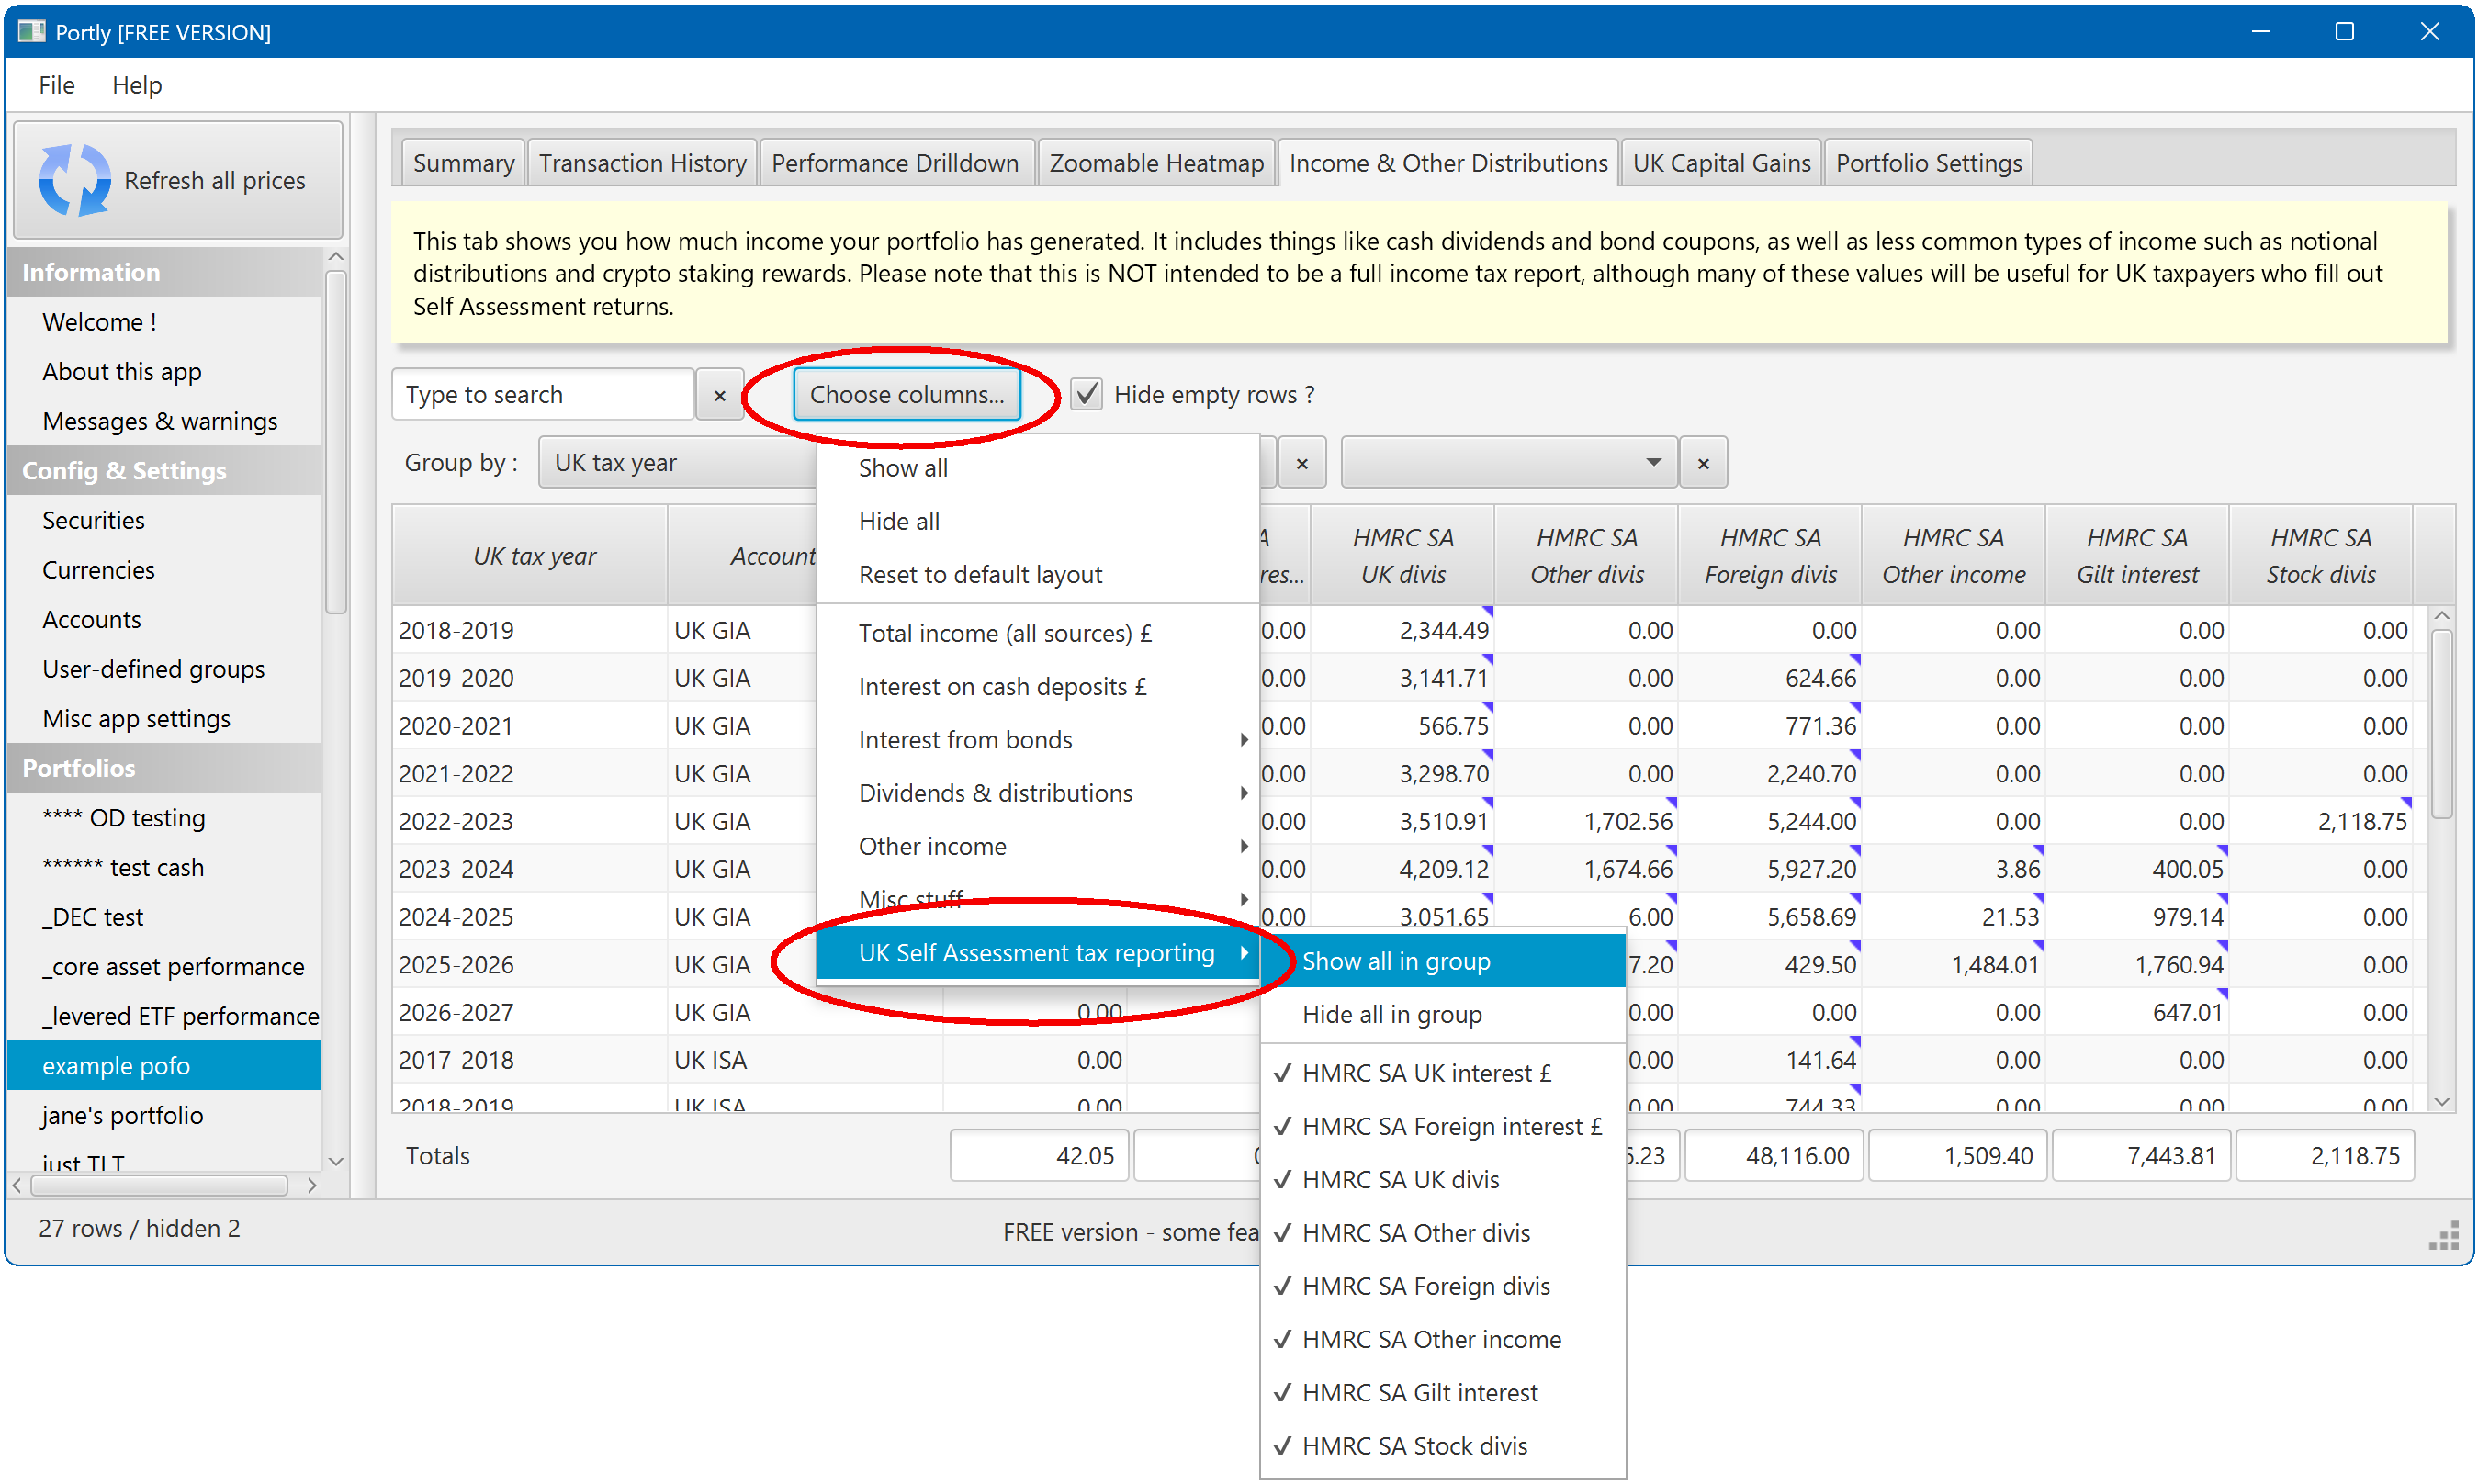
Hover over each column to see more information (the popup text also tells you which box number the income should be reported in).
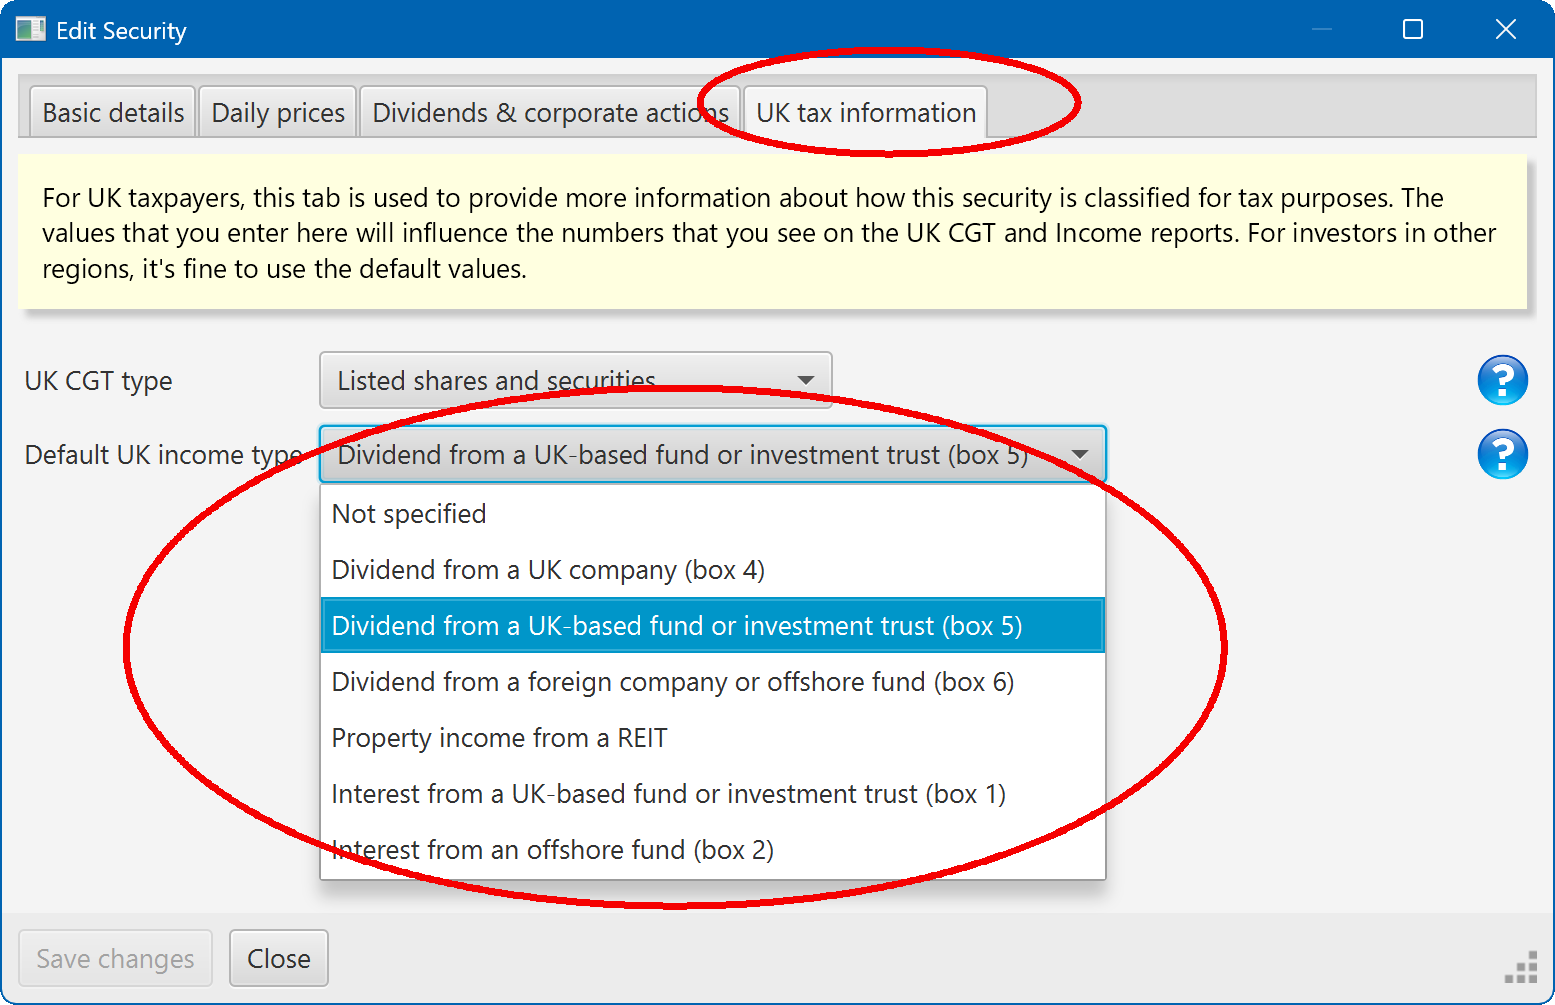
In order for this report to give accurate information, you need to ensure that your securities are set up correctly. On most securities (excluding Gilts), there's a tab labelled 'UK tax information'. This lets you define exactly how income from the security should be classified, from an income tax perspective :
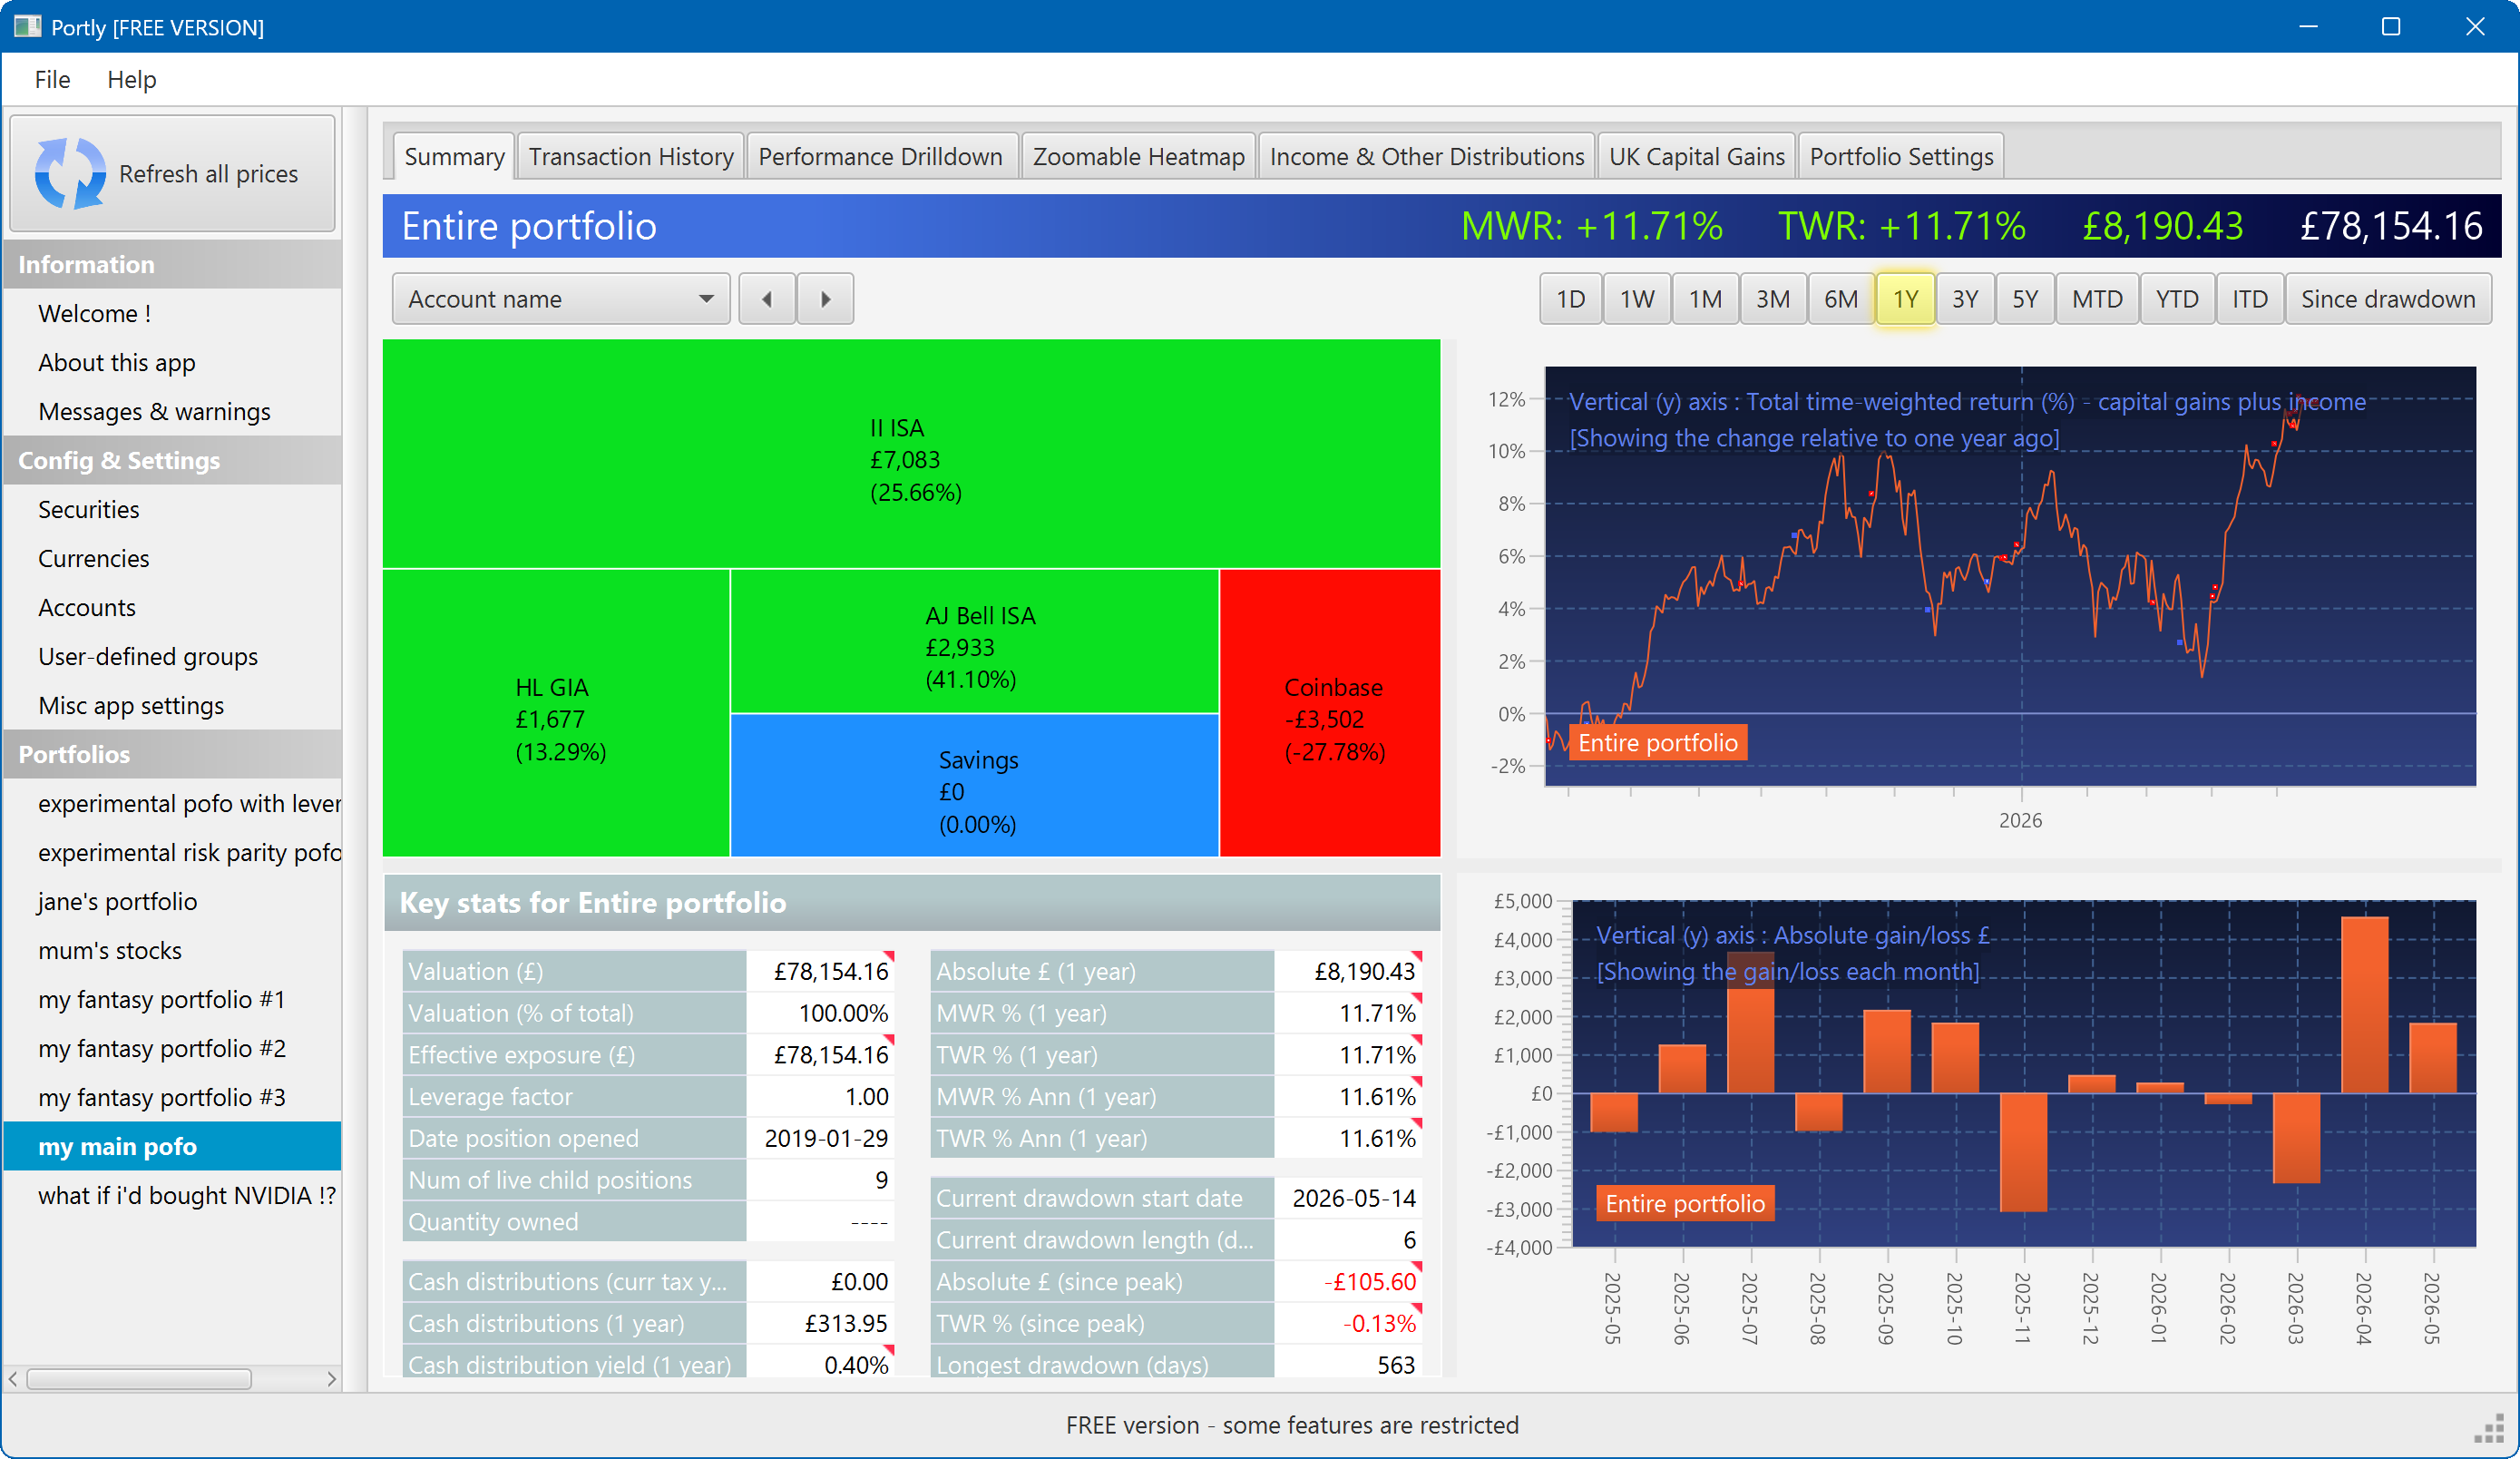
The summary screen gives an at-a-glance overview of your portfolio's performance. To read more about it, click here
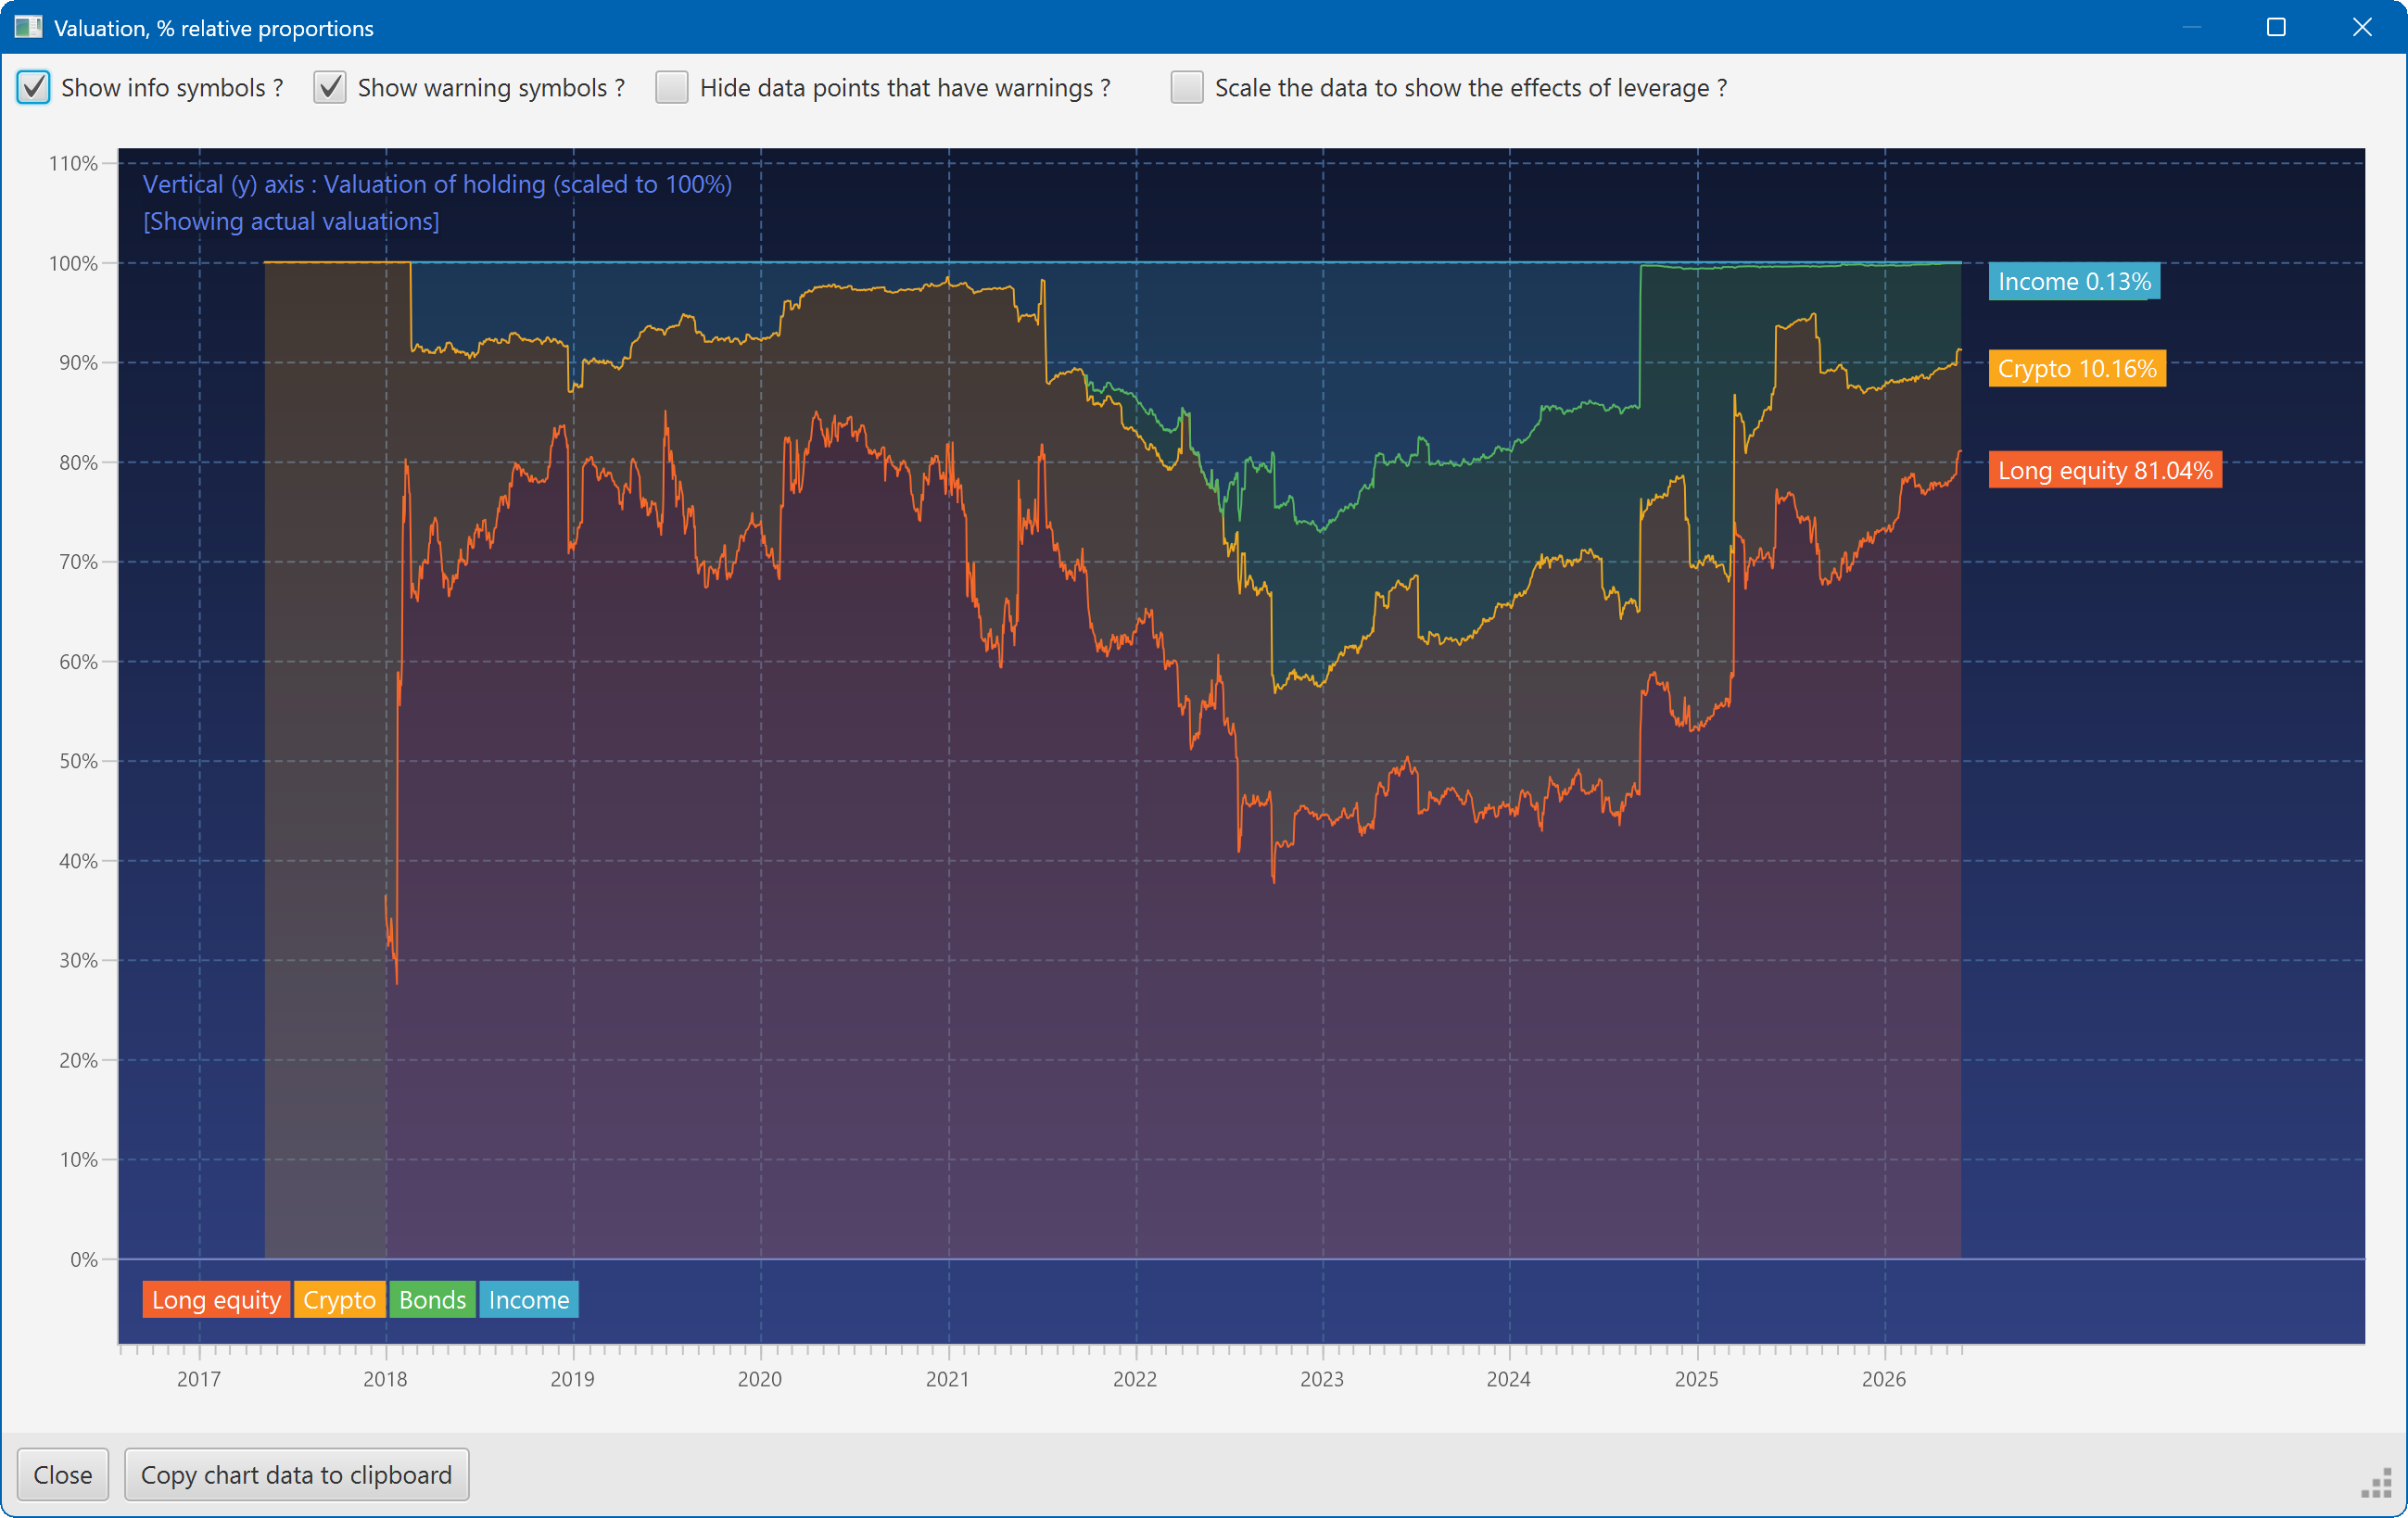
This plot shows the changing composition of a portfolio over time. It uses user-defined groups to organise the assets into different classes.
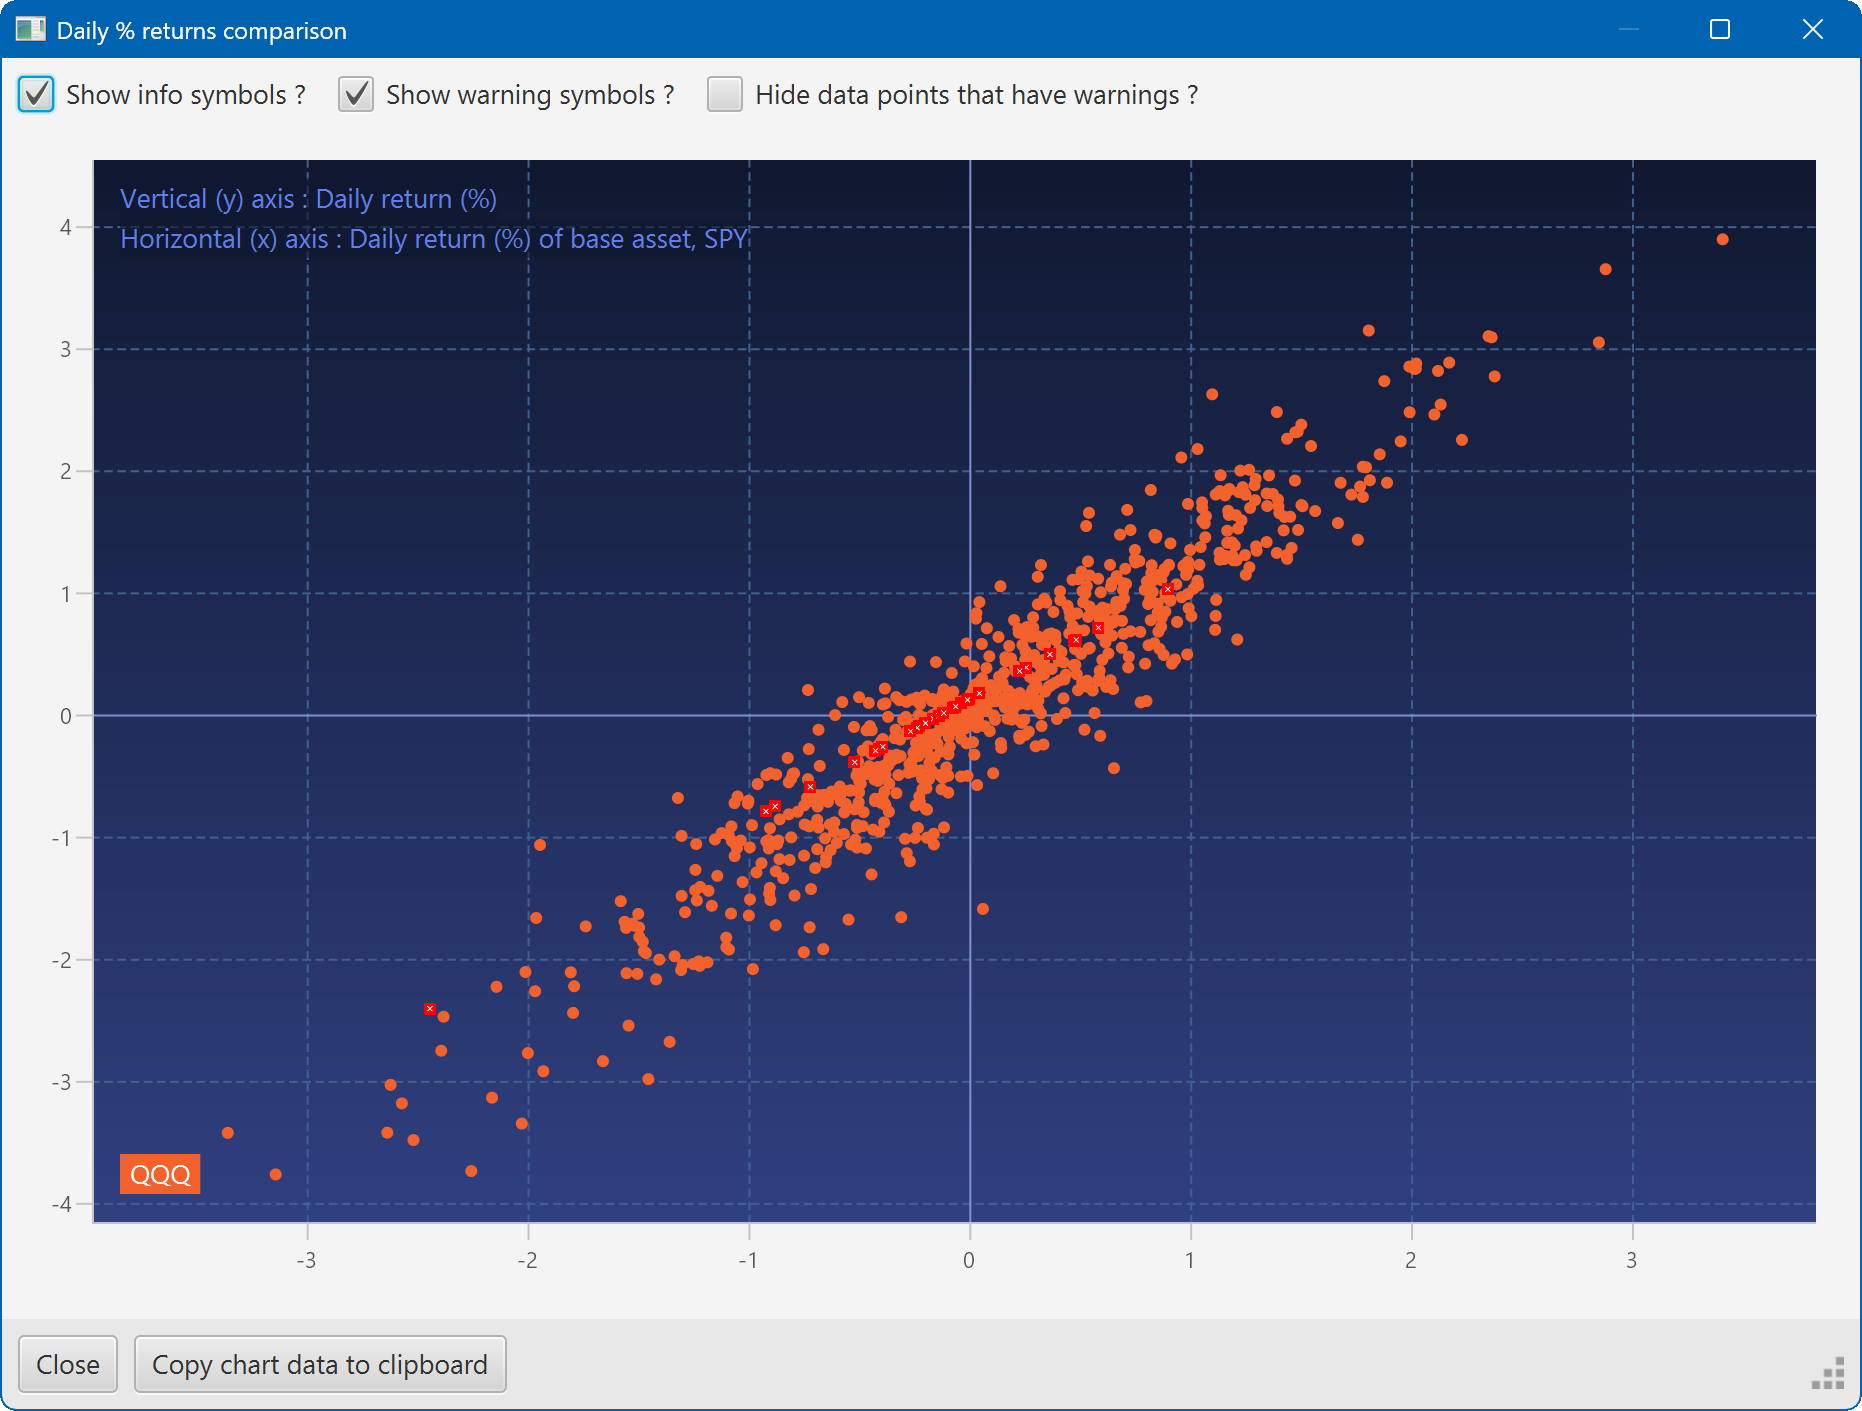
A scatter plot, showing how the daily moves of one security (QQQ) relate to the daily moves of another (SPY)
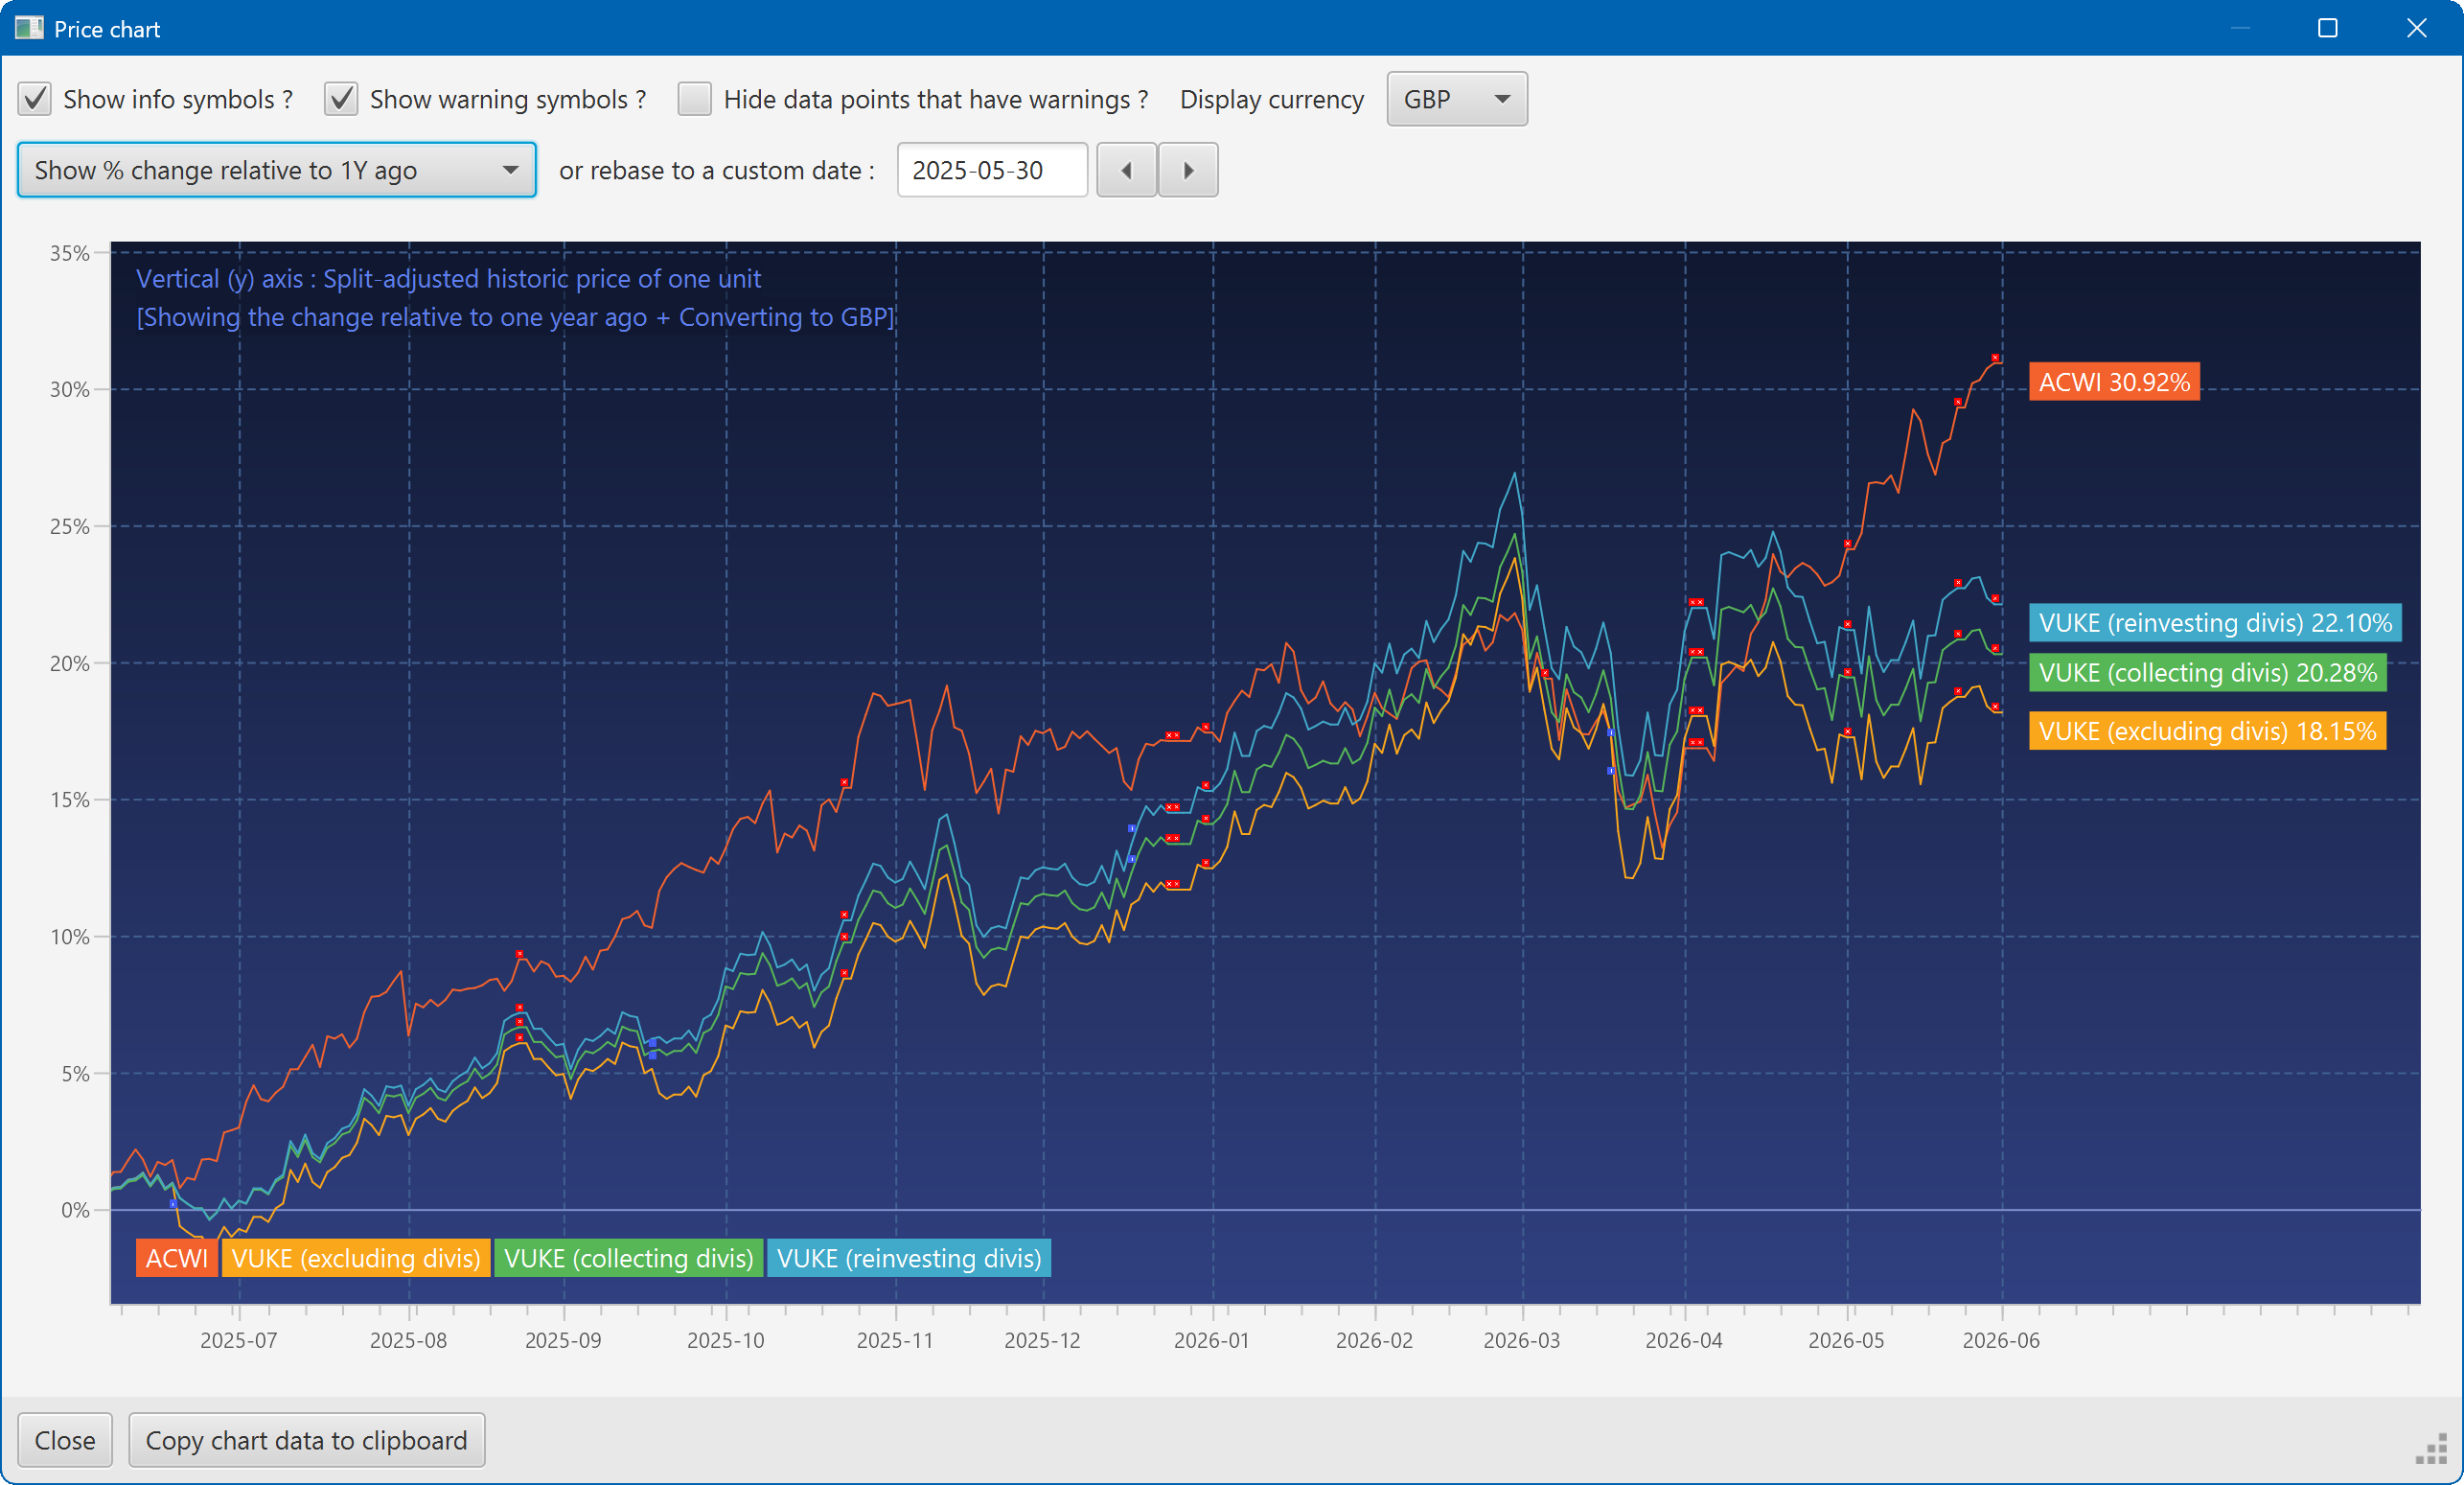
A chart showing the growth of two securities over the past year
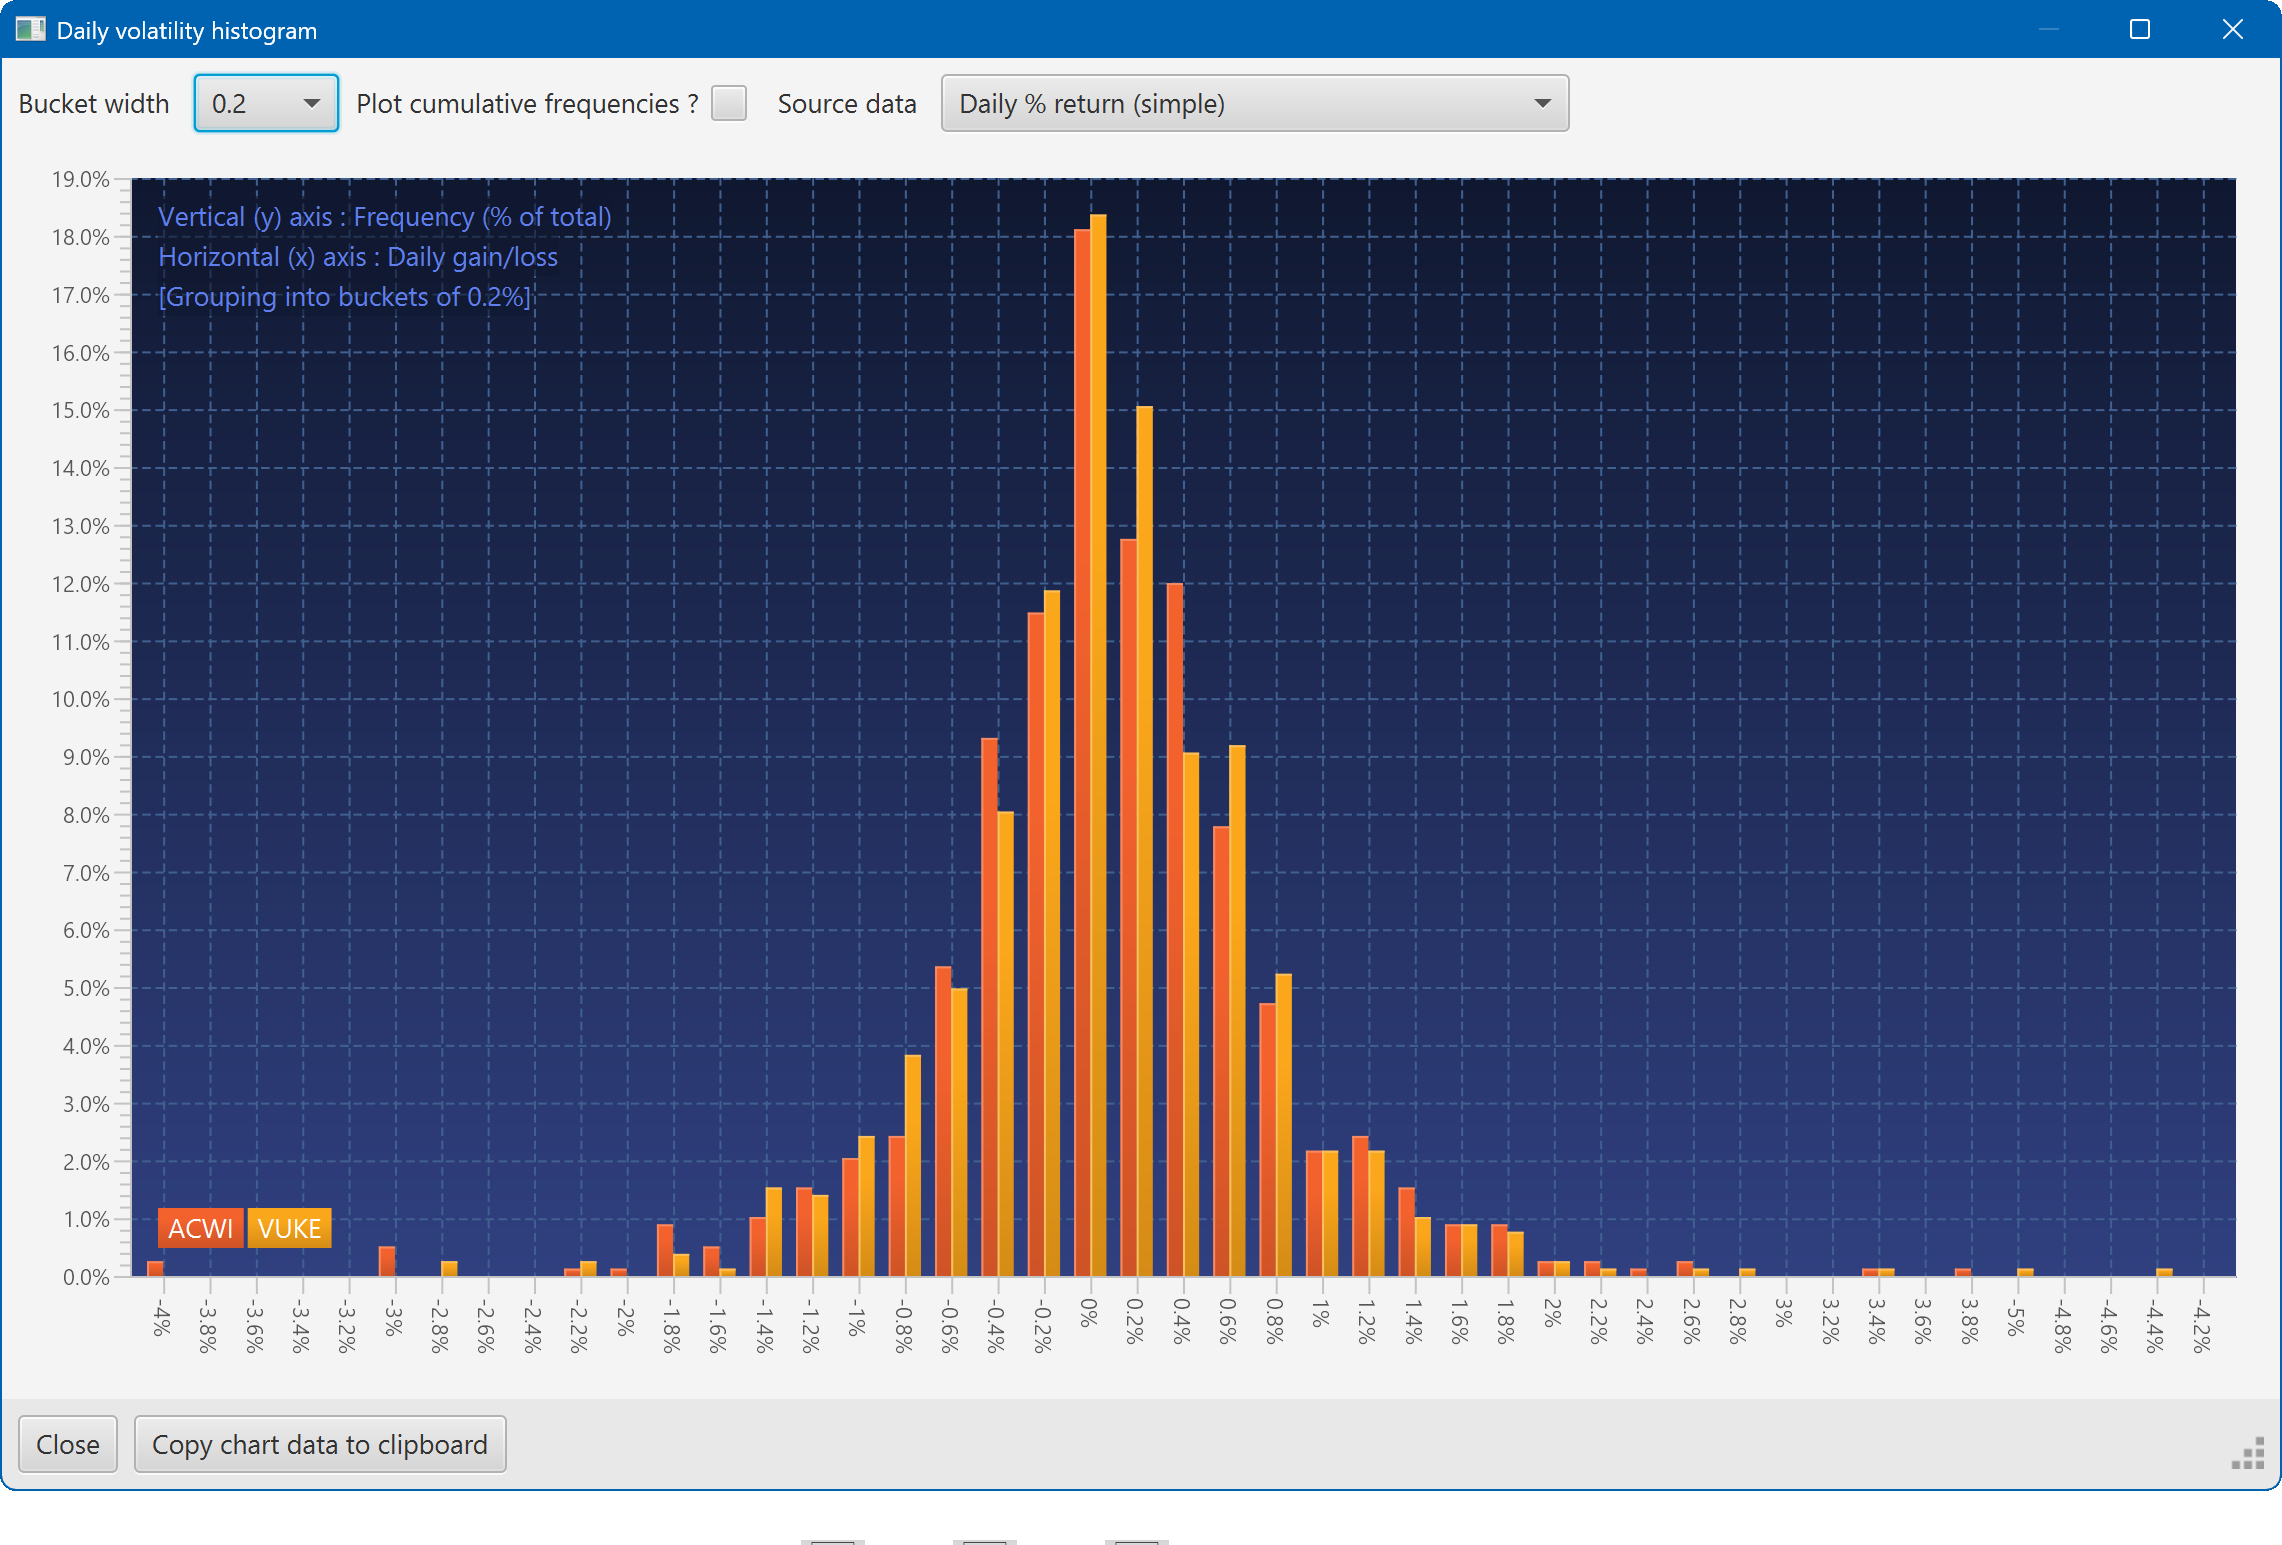
A histogram showing the daily returns of two securities, overlaid
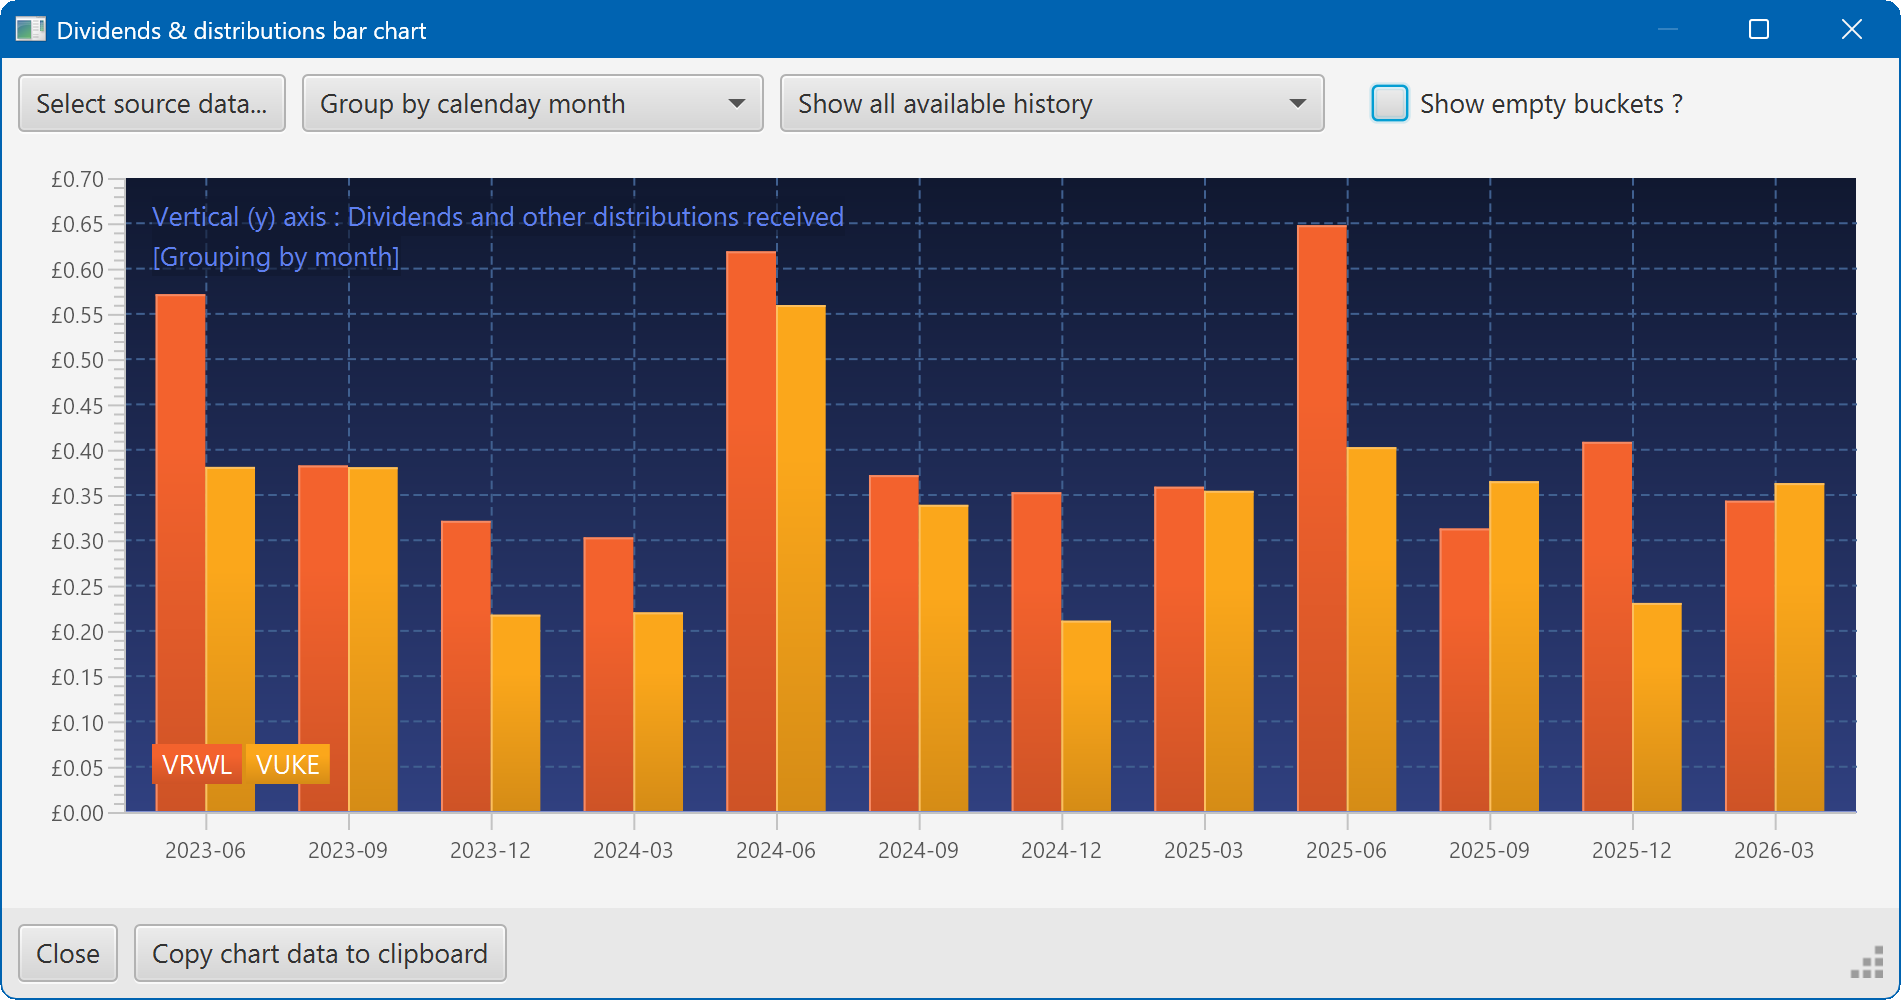
A bar chart showing the dividend history of two securities