
Portly was hand-written by humans (me, specifically) with minimal AI input. For the moment, at least, I believe that nothing beats good old-fashioned human craftsmanship !

Welcome to the home page for Portly ! Thanks for visiting.
Portly is a desktop-based application that's designed to help individual investors keep track of their portfolios. It started out as a bit of a passion project in late 2021 - something to keep me busy during retirement. I needed something to help me manage my growing collection of SIPP and ISA investments, but I couldn't find an existing app that met all my requirements. So why not have a crack at writing my own ? A few years (and lots of late nights !) later, Portly has grown into a fairly powerful system with some quite nice features, and I continue to add to it on a fairly regular basis. I hope you'll give it a try.

-- Chris F (author of Portly)
What can Portly do ?
Here's a summary of the key features. Click on the links for more detail.
- Powerful analysis tools. Portly's drilldown report enables you to zoom into your portfolio in fine detail, to really understand what's driving your returns. Portly is able to calculate a range of performance measures including money-weighted return (MWR) and time-weighted return (TWR), as well as more advanced stuff like correlation, realized volatility and relative performance. There are a variety of interactive charts to help you visualise what's going on.
- Tax assistance. For UK users, Portly can generate detailed capital gains reports to help you fill out your tax return each year. It can even show you how large your CGT bill might be, if you decide to sell your existing holdings (a sort of interactive "what if ?" analysis). Portly also has a dedicated income report to keep track of your dividends and other income.
- Multiple portfolios. Portly makes it simple to maintain multiple independent portfolios and switch between them at the click of a mouse (useful for testing alternate investing strategies, or managing the investments of multiple family members). You can also plot the performance of one portfolio against another.
- Multiple asset types. Portly has built-in support for Leveraged ETFs, crypto-assets and UK government bonds (Gilts) in addition to "vanilla" shares and funds.
- Multiple currencies. Cash amounts can be entered using whatever currency makes most sense. GBP, USD, JPY or whatever you like. You can plot charts of each currency's performance and compare them against each other (click for more info)
- Simple yet flexible user interface. I don't have much patience for confusing UIs and cryptic icons, so I've tried to make everything as clear and straightforward as possible. There are integrated help boxes on all the major screens to help you find your way around (expert users can turn these off if they get annoying). Using user-defined groups, you can organise your investments in exactly the way you want. For those who want maximum flexibility, you can completely alter the appearance of the app by editing its CSS config file.
- And lots more... Portly has support for a wide range of corporate actions including cash-based dividends, share splits, in-specie dividends and return of capital. Portly also understands "notional" distributions from accumulating funds (sometimes known as Excess Reportable Income or ERI), as well as equalisation payments.
A couple of other things that might be important to you : First, Portly stores all data locally, on your own PC. You're not reliant on a cloud-based application with questionable security that may vanish at any time (for the techies out there, I use the tried-and-tested Sqlite SQL database). And second, Portly was written by humans (me, specifically) with minimum AI input. I'm not against AI per se, but I'm not a fan of the vibe-coded slop that pervades so much of the modern internet. For the moment, at least, nothing beats good old-fashioned human craftsmanship !
If you're still reading and would like to take Portly for a spin, check out the download page.
What can't Portly do ?
Portly definitely has some rough edges and missing features. To avoid wasting your time, here are a few reasons why it might NOT be the right app for you :
- Some features of Portly are oriented towards a UK audience. You can still use it to track portfolios in other countries, but the CGT calculator and income reports won't make much sense for non-UK users
- You'll need to import your data into Portly manually (there's not YET support for importing transactions from your favourite broker account, but it's on my to-do list)
- Portly fetches all market data from a number of popular mainstream finance websites. I can't guarantee that these sites will continue to function forever (although of course, I'll do my best to keep Portly updated as things change)
- Portly is geared towards long-term investors; if you're looking for a tool that provides short-term "trading signals" or the like, it isn't for you
- Although Portly has support for foreign currencies, all cash balances are displayed in your local currency (this is equivalent to the 'auto FX' feature that many of the larger platforms provide). There's no support (yet) for manual FX transactions.
- The crypto support isn't 100% complete. Portly supports buy, sells, staking rewards, airdrops, inter-wallet transfers. But it can't yet handle the exchange of one token for another (although this is on my to-do list).
- Portly doesn't capture information about any tax that's been deducted from foreign dividends (not yet, anyway).
- There's no support for shorting assets. I might add this one day, but it's not a priority.
- Portly is offered on a 'freemium' basis. It's free to use, but certain features are limited unless you choose to buy a one-time Premium upgrade. You can find out more here
Most importantly : there may be bugs ! I've done my best to test everything thoroughly, but there's no guarantee that everything is working 100%. Please use Portly at your own risk.
FAQs
Why bother with an app ? Can't I get all this stuff from my online platform ? Yes, to an extent. Pretty much all platforms give you some basic information about the performance of your portfolio. Some even offers basic tax-related information. But what if you've got accounts with multiple providers ? What if you want to do more in-depth performance analysis ? What if you've got capital gains in your GIA account and you need to generate a CGT report ? What if you own crypto alongside more conventional assets ? And so on. Situations like this are where a dedicated app really comes into its own.
Why not just use a spreadsheet to track my investments ? For several years, that's exactly what I did ! Every weekend I'd log into each of my online accounts, then copy the various valuations across one by one. This worked reasonably well at first, but as soon as I wanted to do a more detailed analysis it all started to crumble. For example, I hadn't been very careful in logging all my cash transactions, so trying to calculate the return on my investments was difficult. I was also interested in grouping my assets by several different dimensions, but this became increasingly fiddly as time went on. And filling out my annual tax return was getting more and more complicated. Portly solved all these problems for me.
Why Portly and not [some other app] ? Quite simply, because I couldn't find an existing app that did exactly what I wanted. I needed support for assets such as Bitcoin and UK Gilts, with CGT reporting and plenty of charting options. I needed support lesser-known concepts such as Excess Reportable Income, in-specie dividends and so on. And most of all, I wanted an app that ran locally so I didn't have to send my private data to a faceless company on the web which might simply vanish one day.
How do I suggest a new feature ? Please see this page
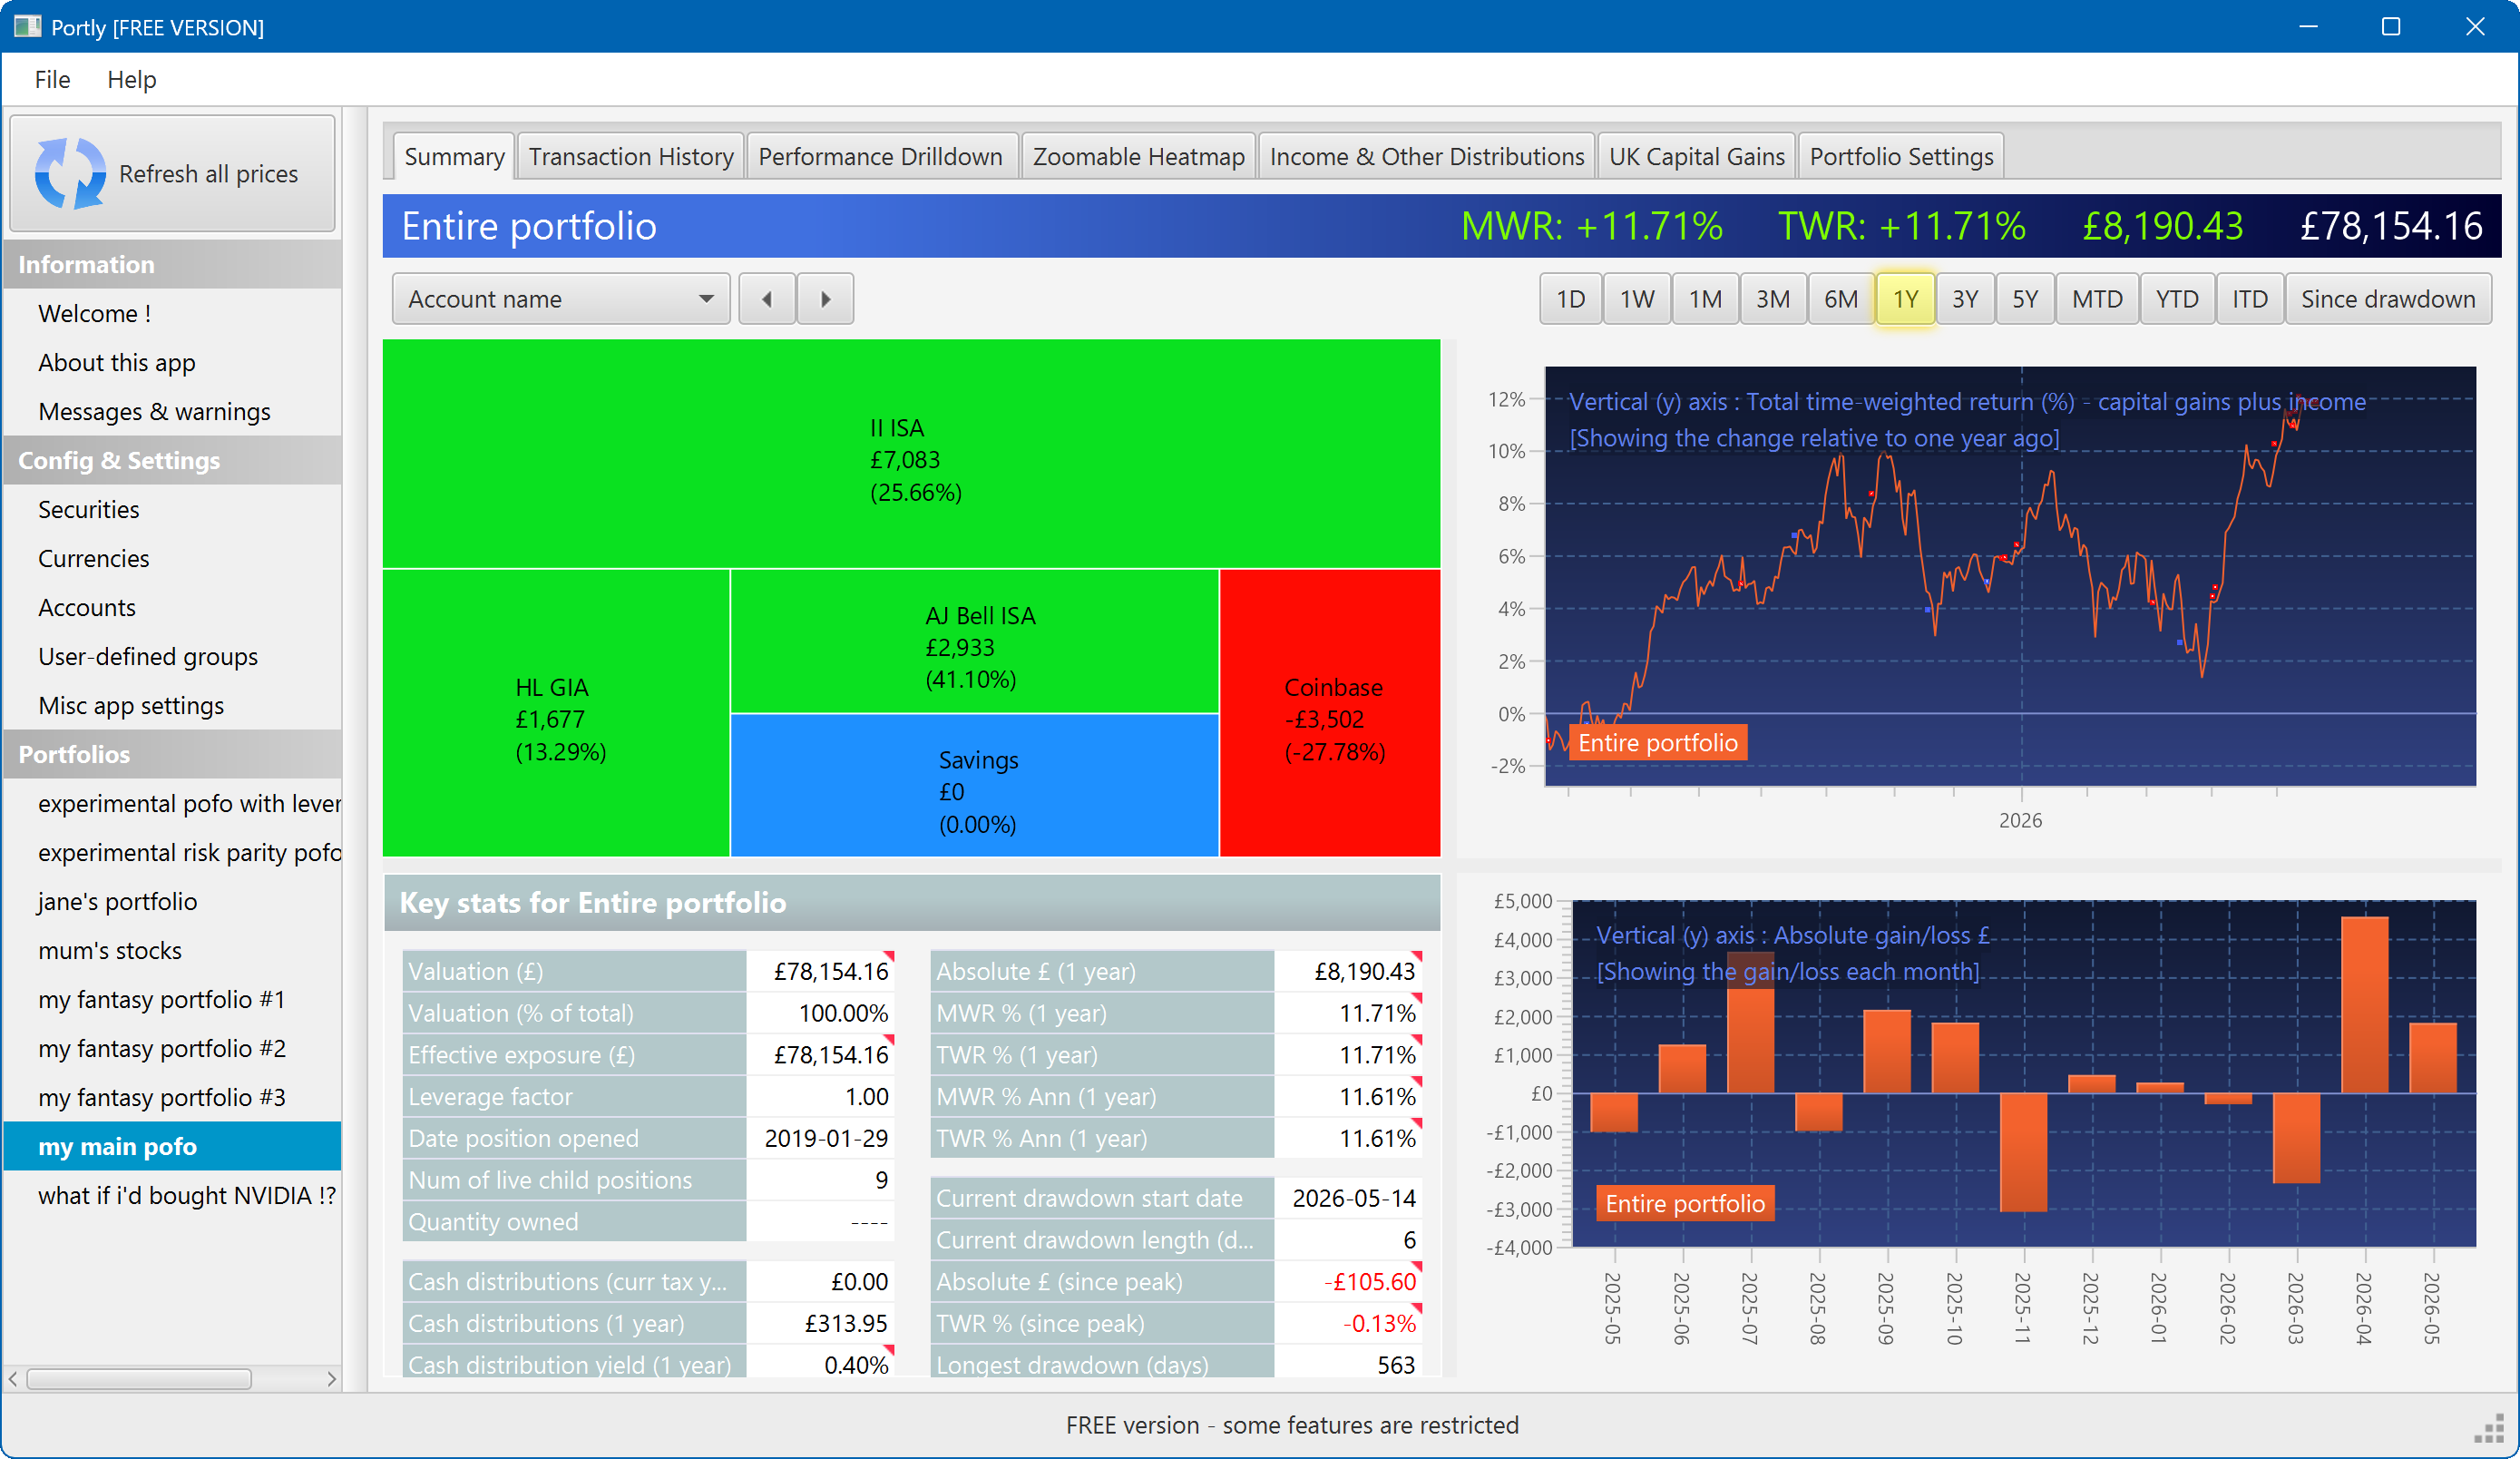
The summary screen gives an at-a-glance overview of your portfolio's performance. To read more about it, click here
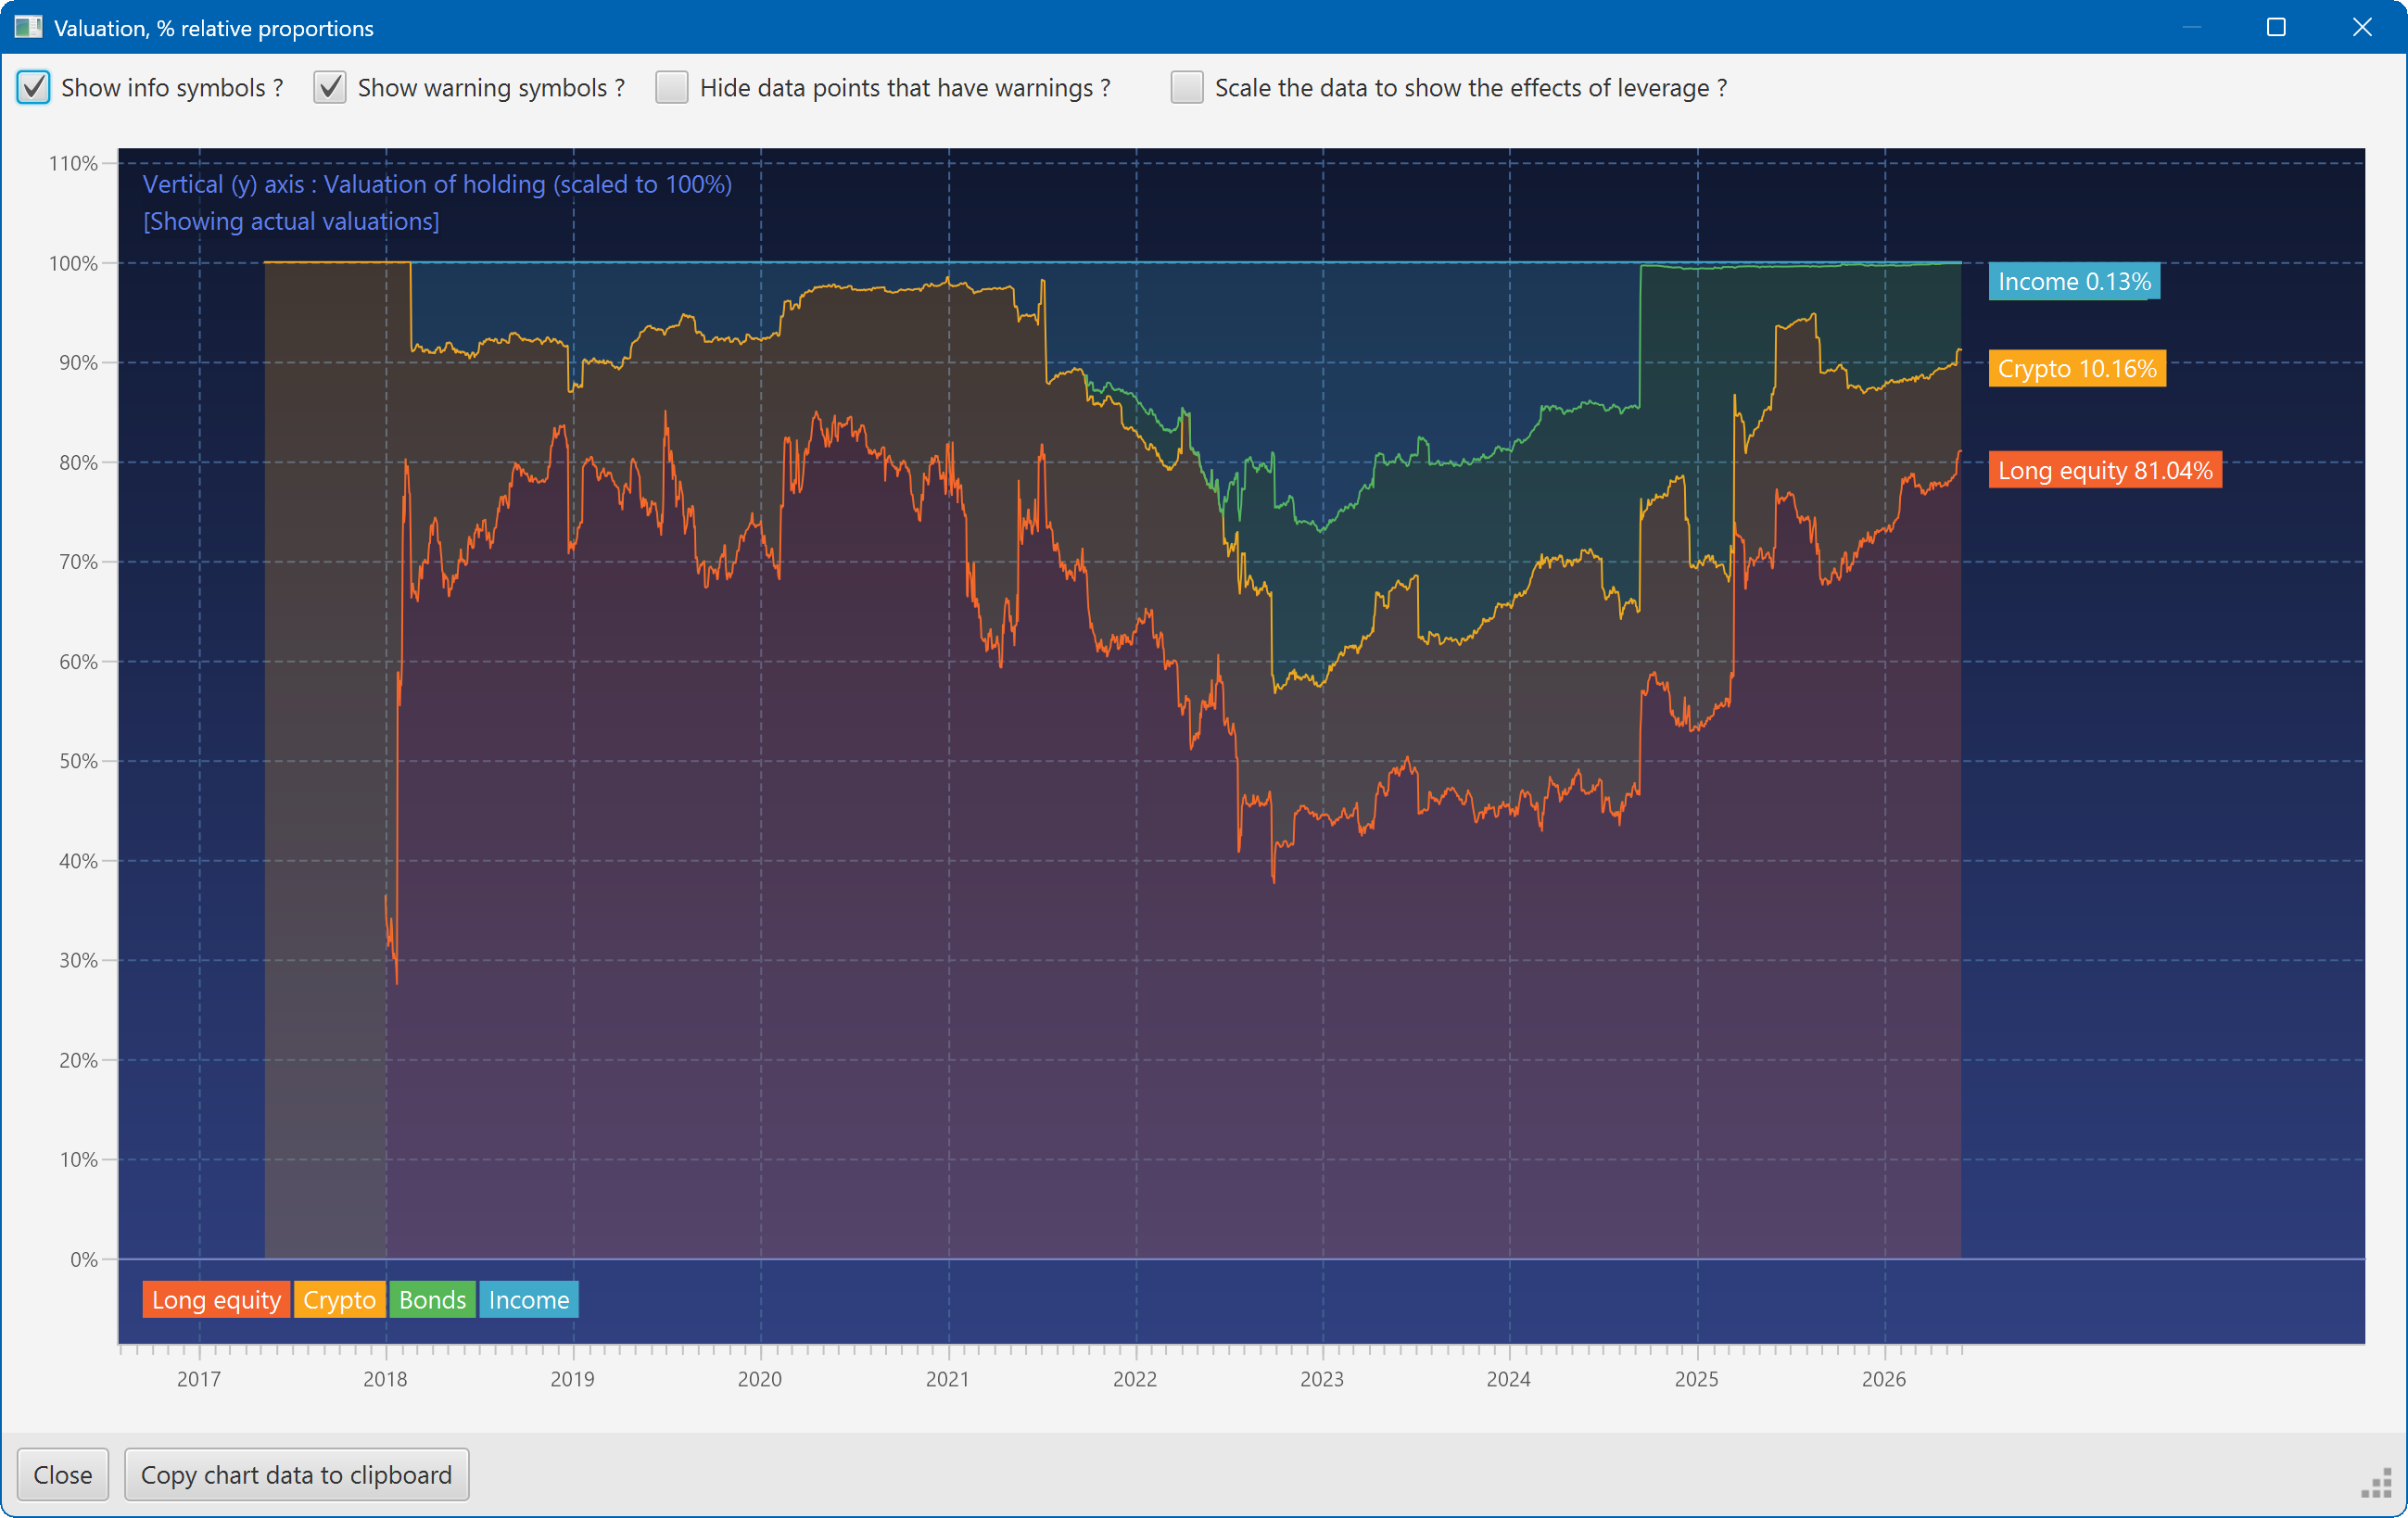
This plot shows the changing composition of a portfolio over time. It uses user-defined groups to organise the assets into different classes.
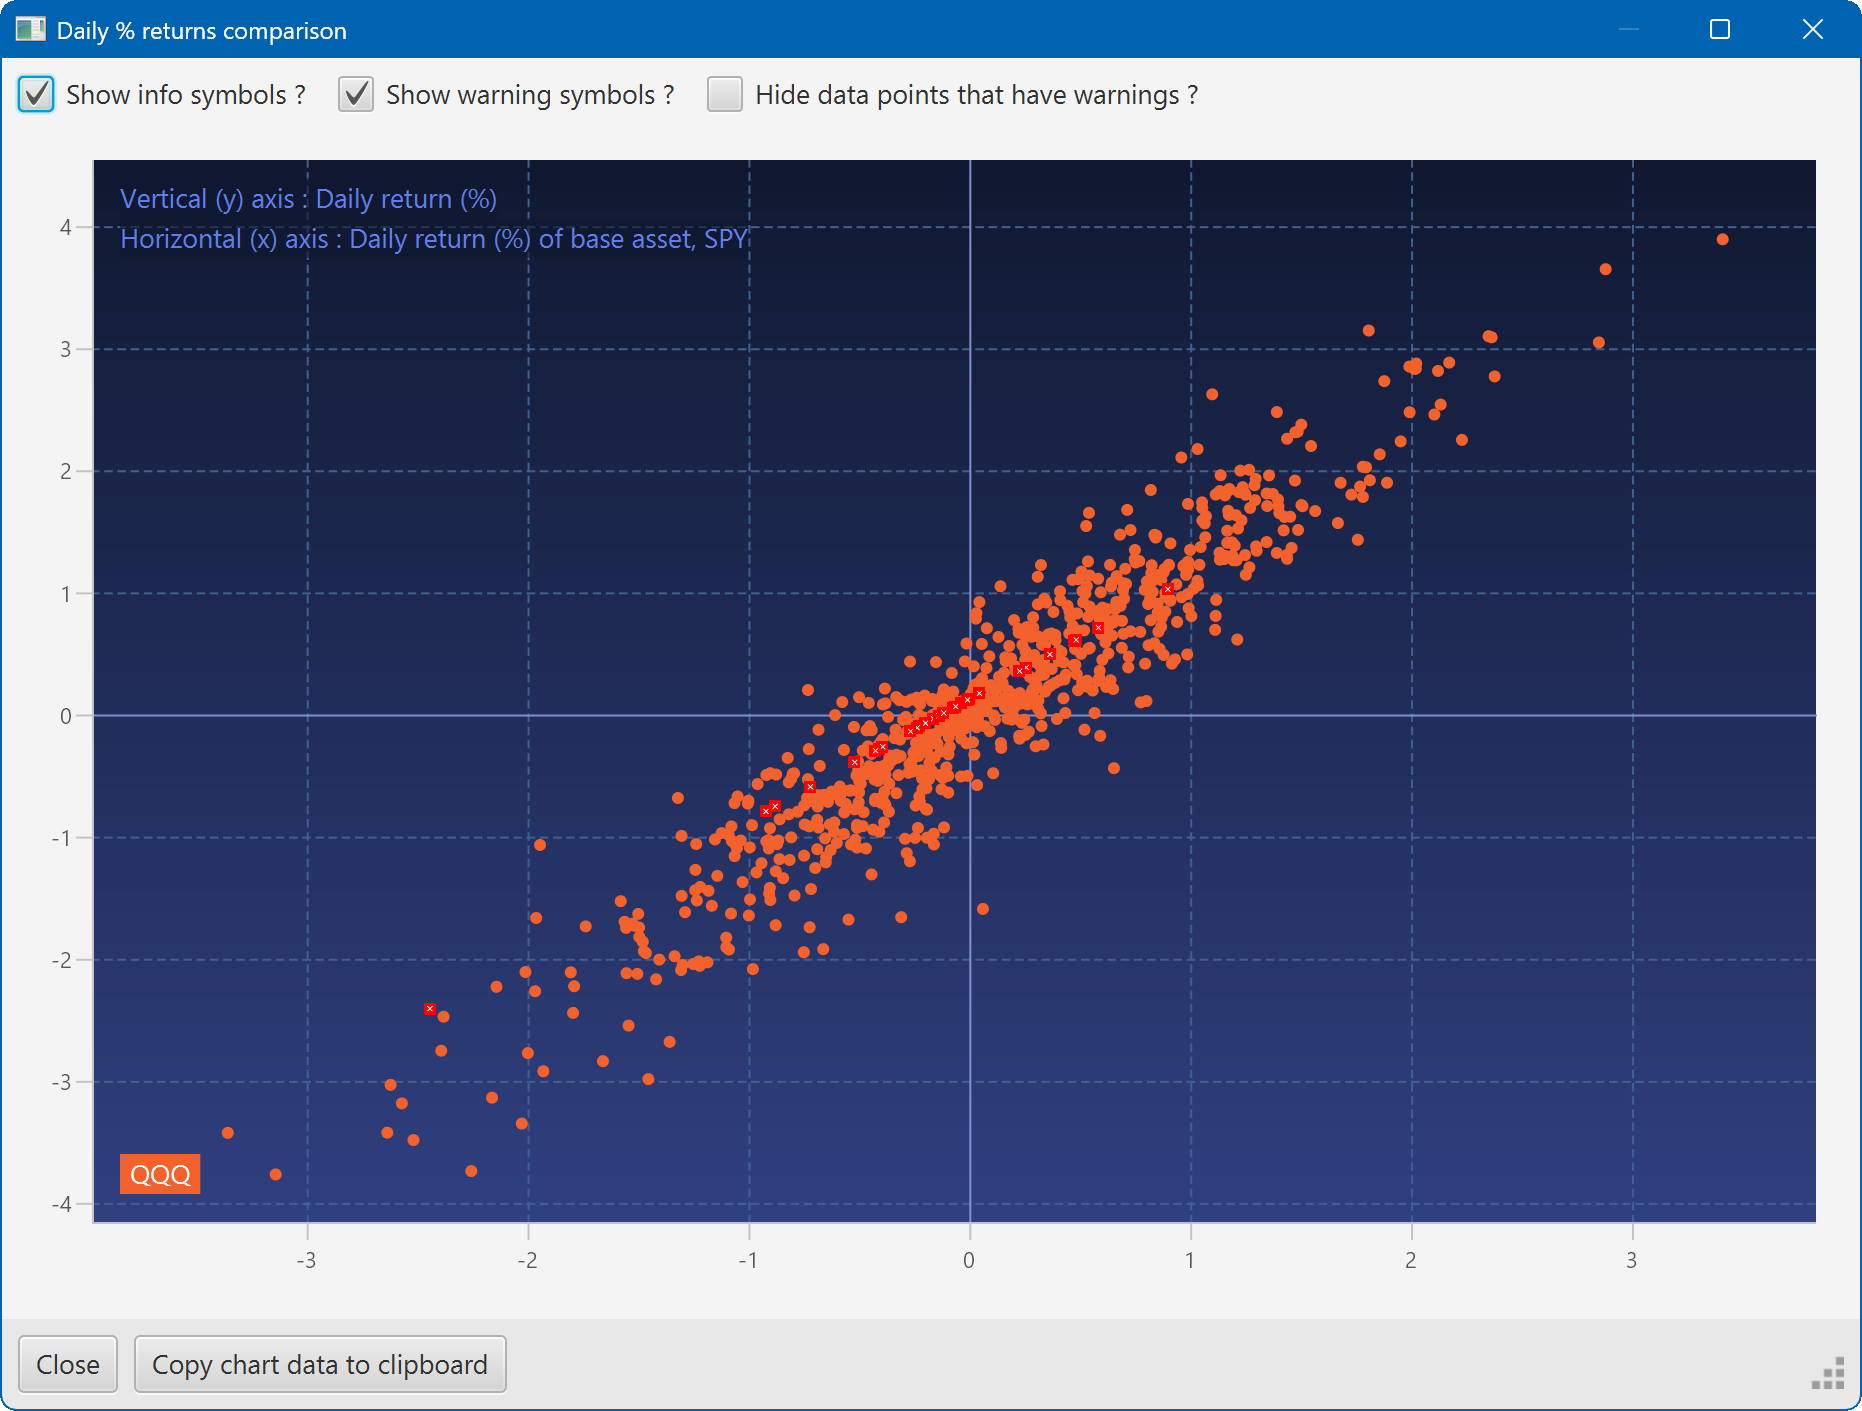
A scatter plot, showing how the daily moves of one security (QQQ) relate to the daily moves of another (SPY)
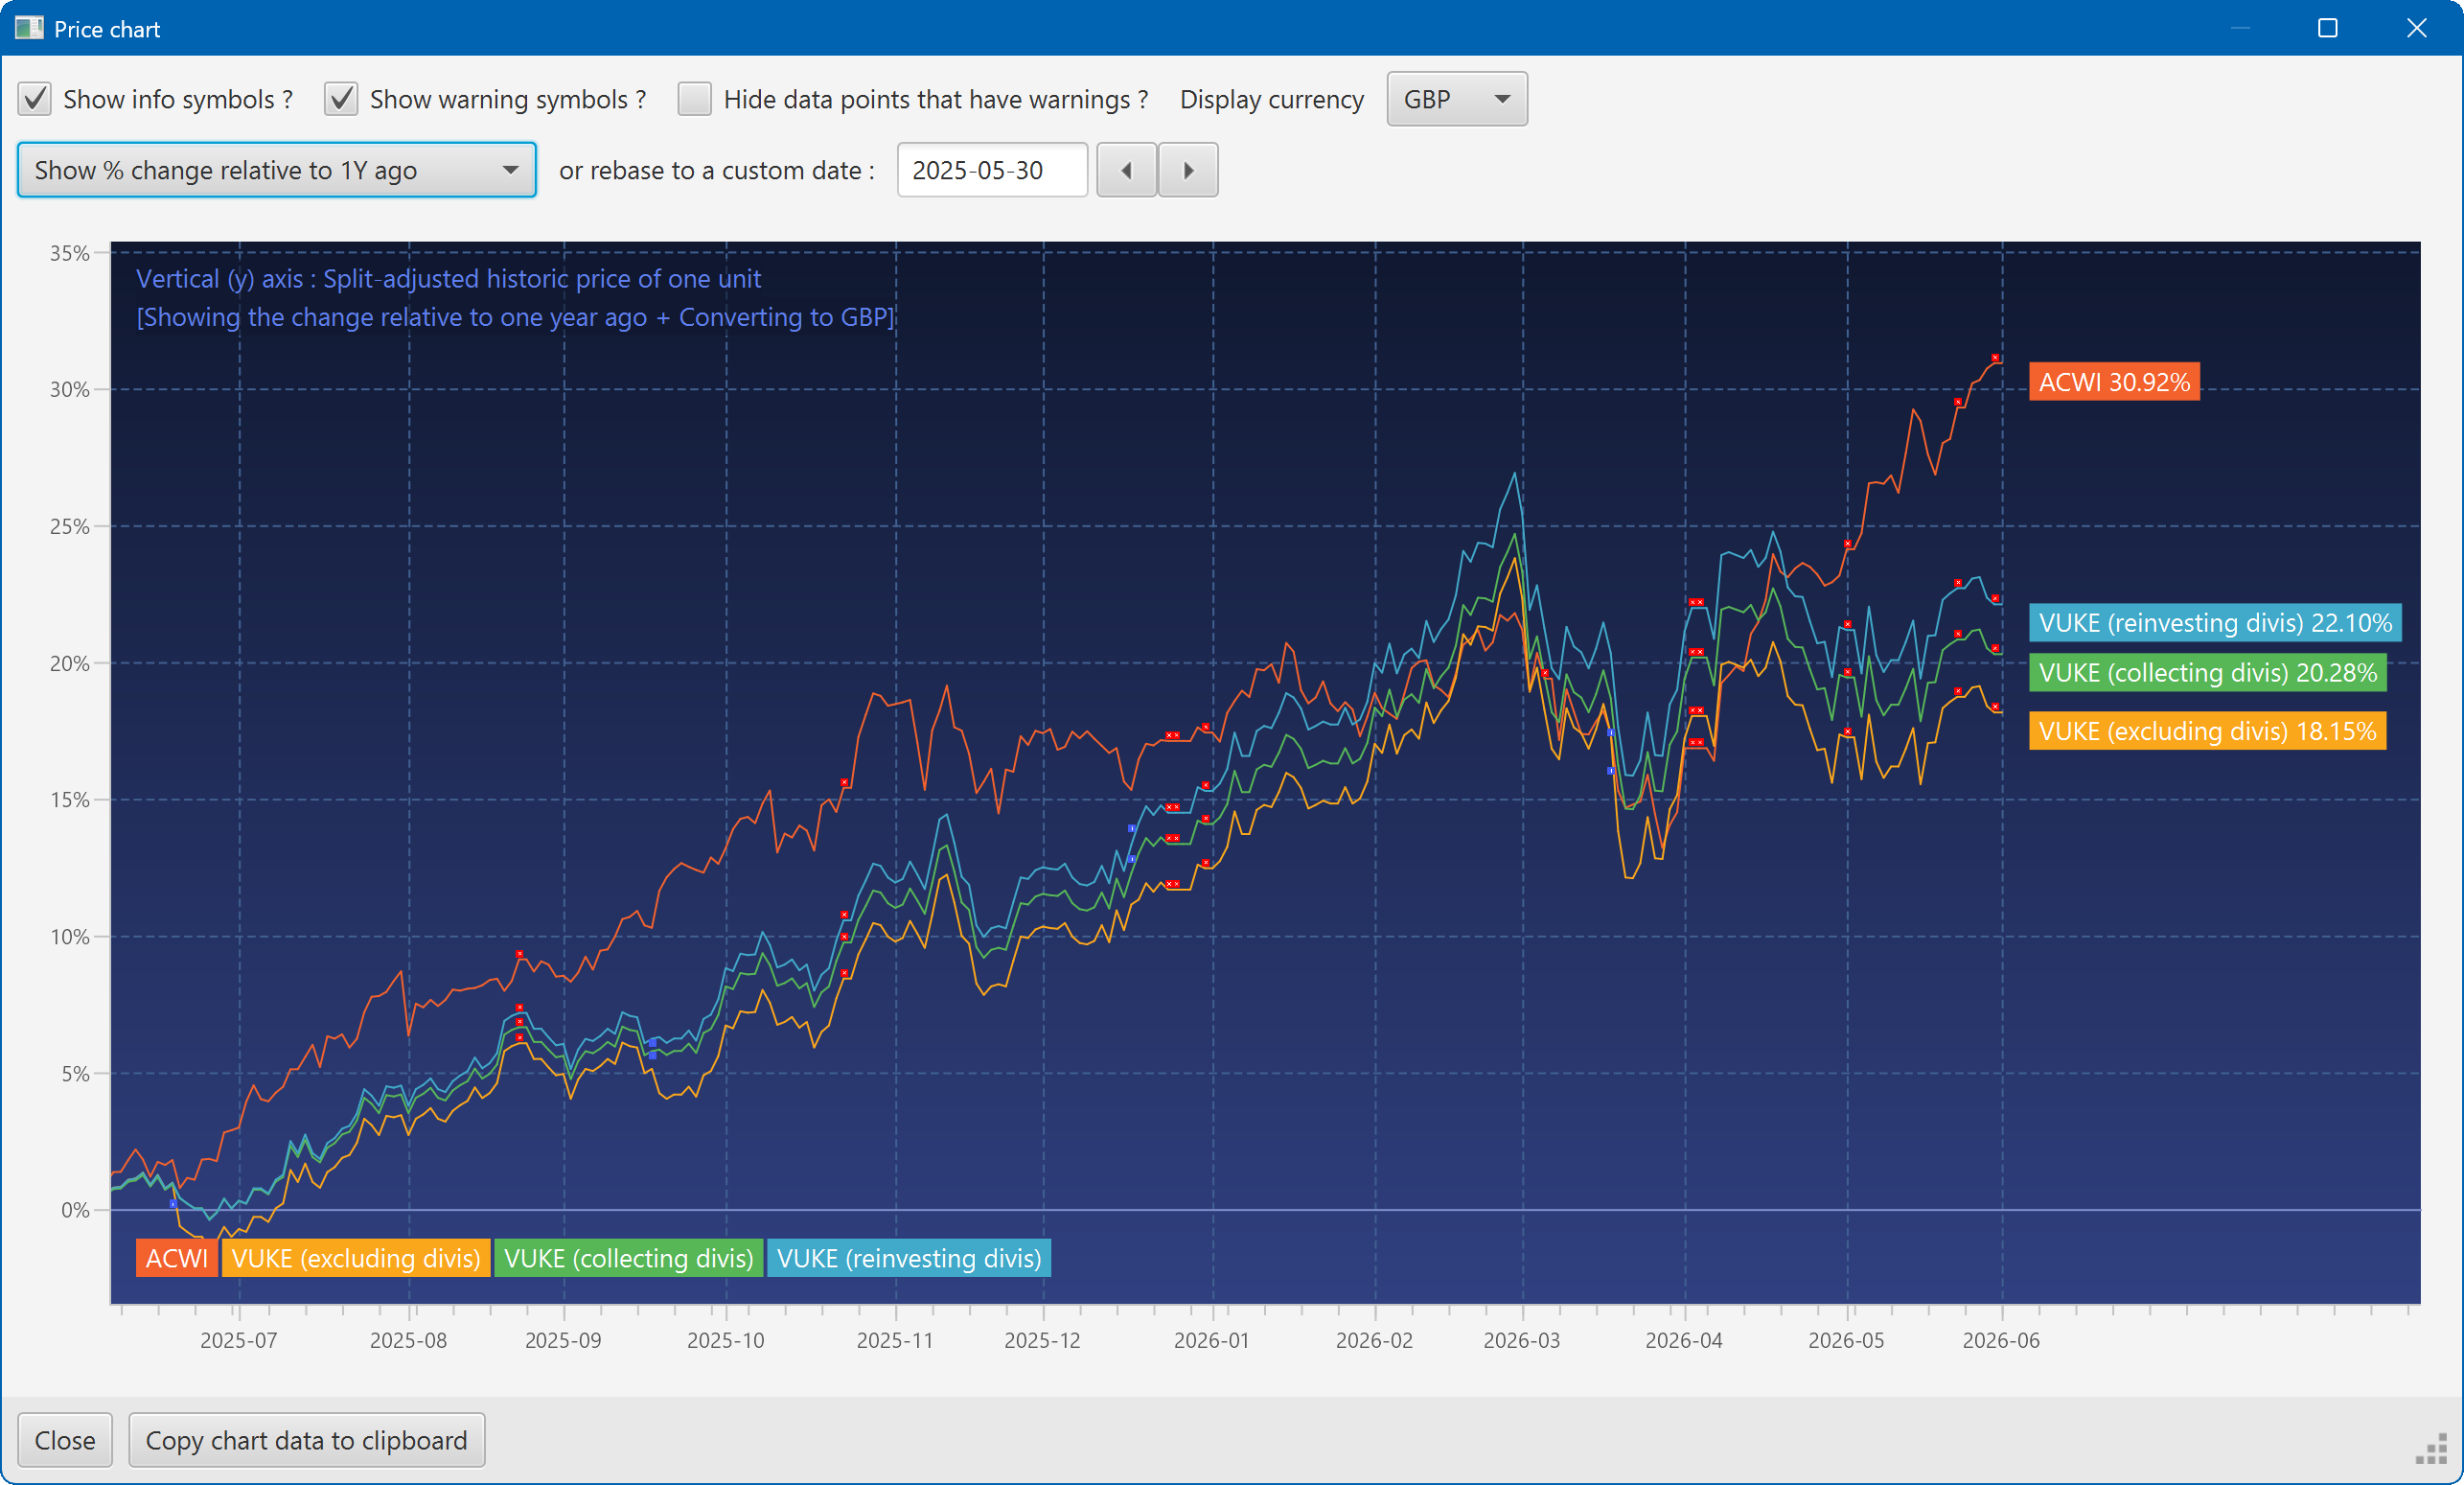
A chart showing the growth of two securities over the past year
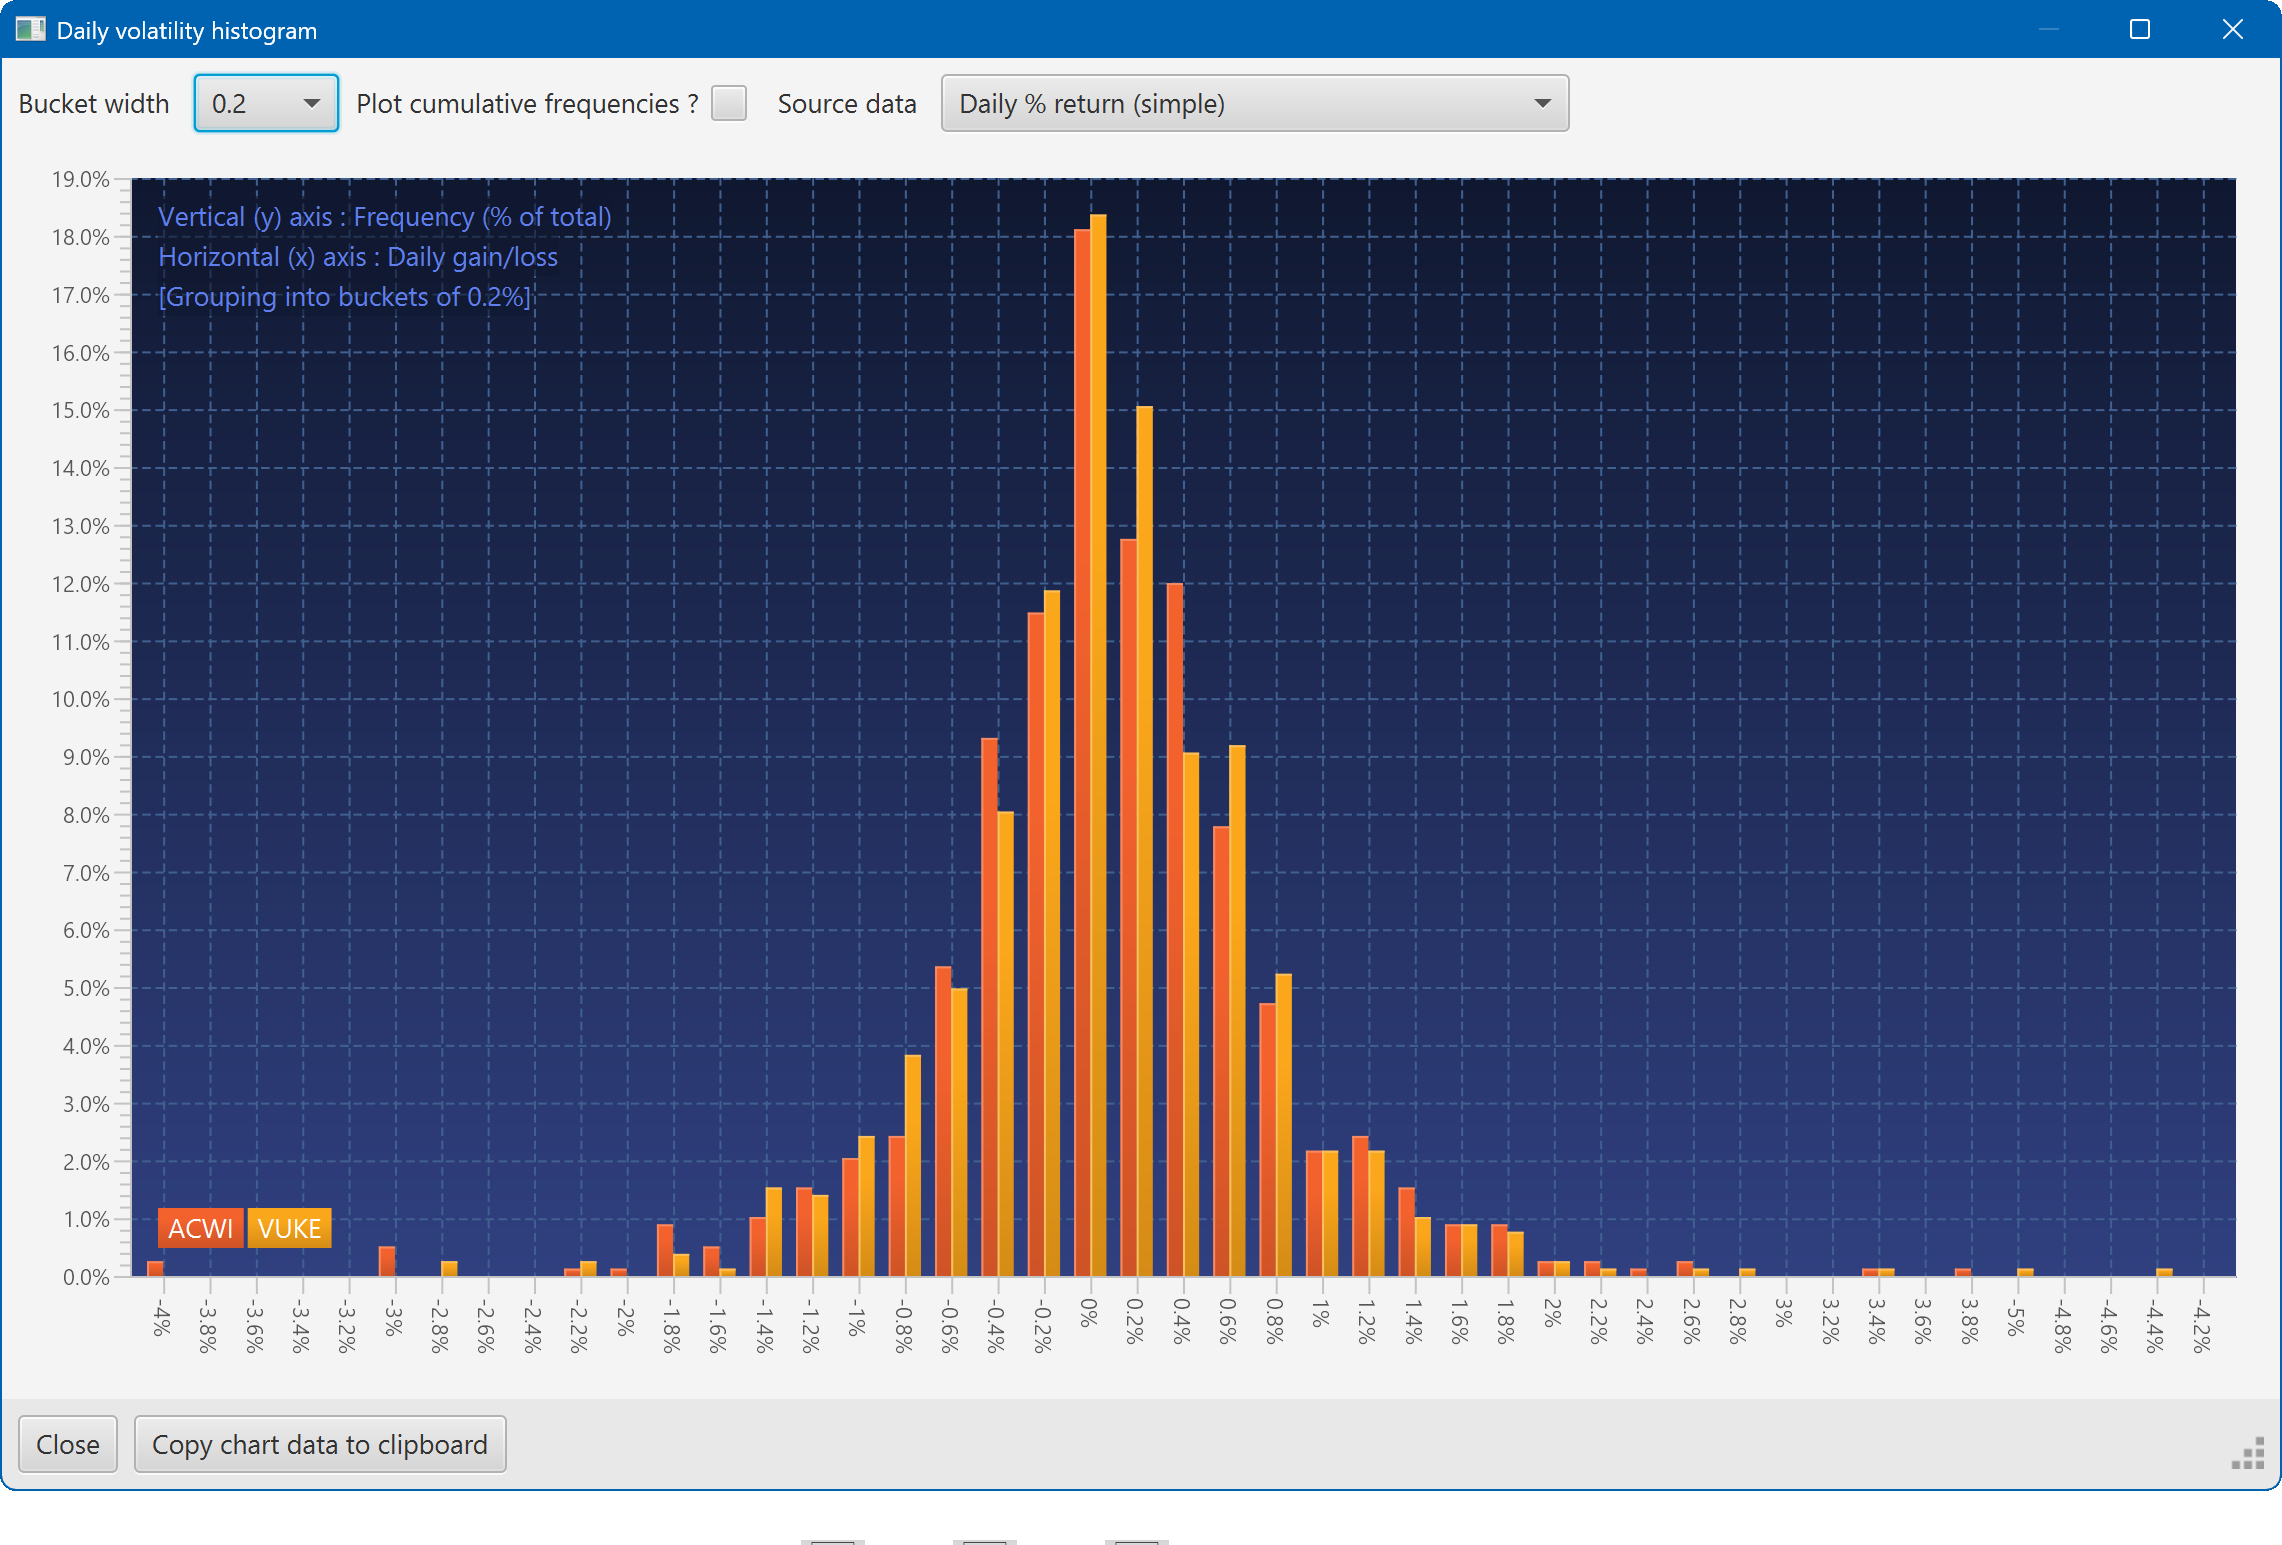
A histogram showing the daily returns of two securities, overlaid
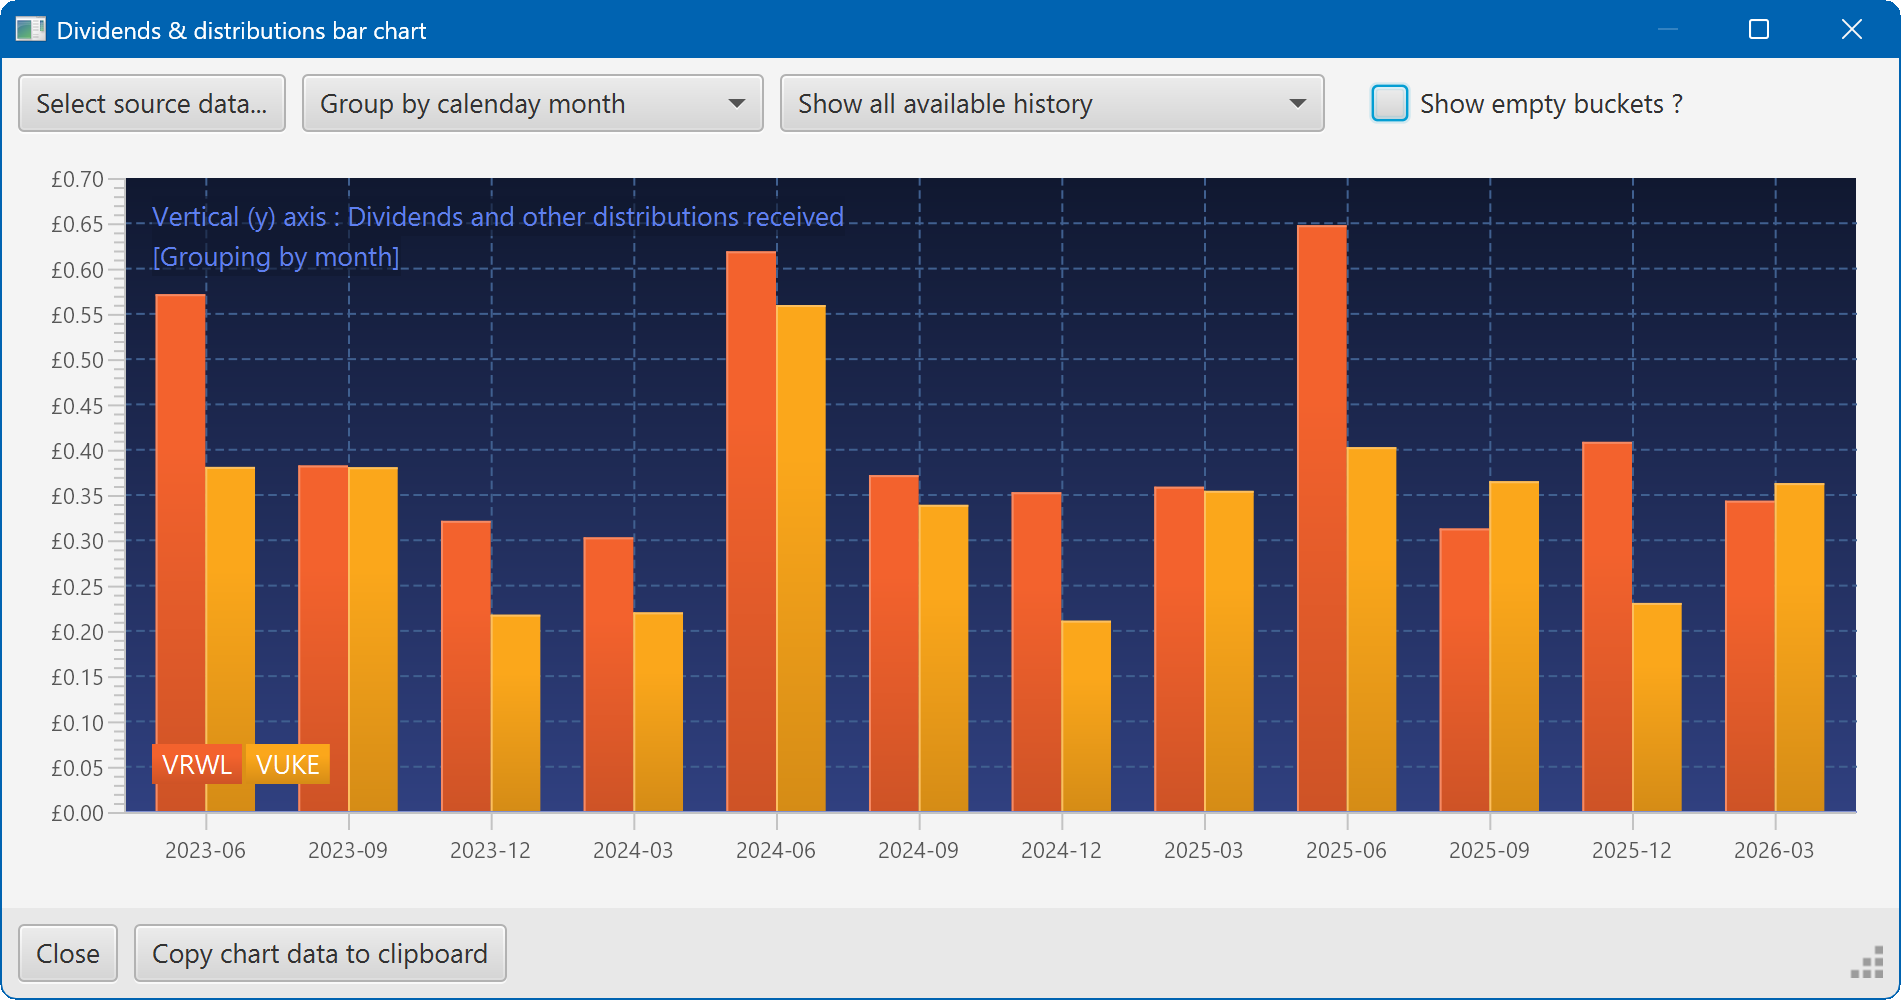
A bar chart showing the dividend history of two securities